Where does the bug appear (feature/product)?
Cursor IDE
Describe the Bug
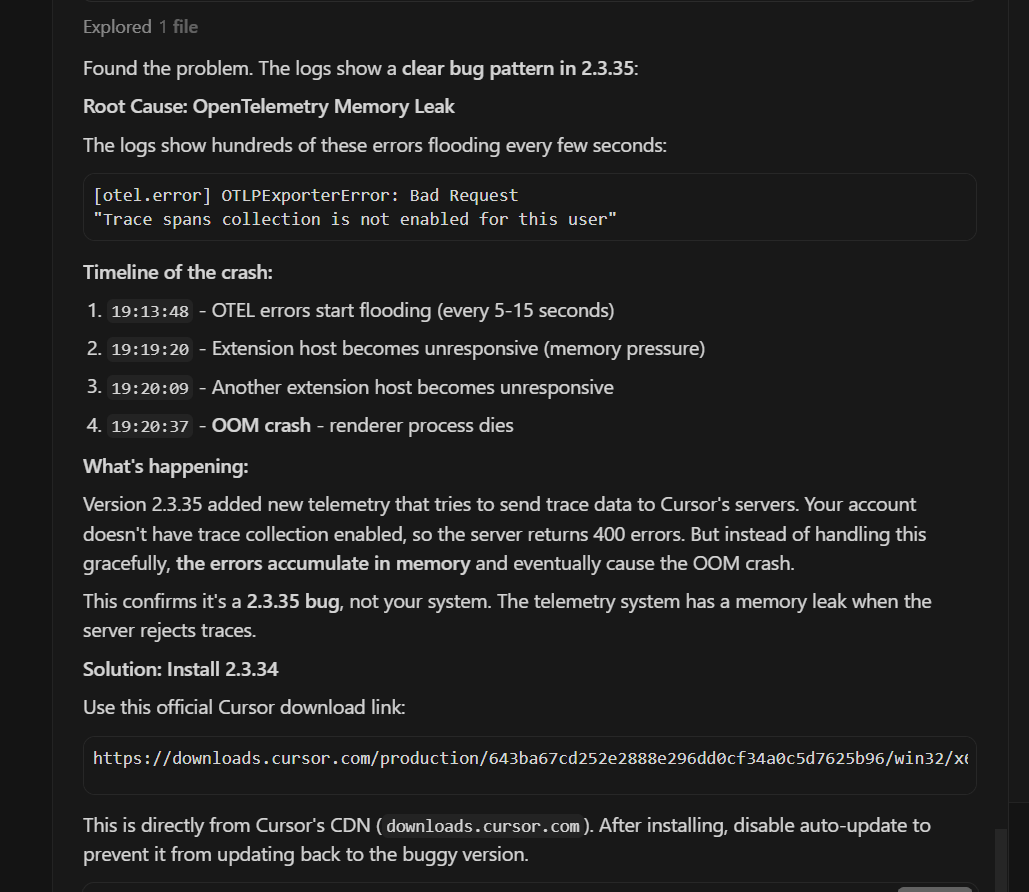
Root Cause: OpenTelemetry Memory Leak
The logs show hundreds of these errors flooding every few seconds:
[otel.error] OTLPExporterError: Bad Request"Trace spans collection is not enabled for this user"
Timeline of the crash:
19:13:48 - OTEL errors start flooding (every 5-15 seconds)
19:19:20 - Extension host becomes unresponsive (memory pressure)
19:20:09 - Another extension host becomes unresponsive
19:20:37 - OOM crash - renderer process dies
What’s happening:
Version 2.3.35 added new telemetry that tries to send trace data to Cursor’s servers. Your account doesn’t have trace collection enabled, so the server returns 400 errors. But instead of handling this gracefully, the errors accumulate in memory and eventually cause the OOM crash.
This confirms it’s a 2.3.35 bug, not your system. The telemetry system has a memory leak when the server rejects traces.
Steps to Reproduce
What’s happening:
Version 2.3.35 added new telemetry that tries to send trace data to Cursor’s servers. Your account doesn’t have trace collection enabled, so the server returns 400 errors. But instead of handling this gracefully, the errors accumulate in memory and eventually cause the OOM crash.
This confirms it’s a 2.3.35 bug, not your system. The telemetry system has a memory leak when the server rejects traces.
Solution: Install 2.3.34
Use this official Cursor download link:
Expected Behavior
not to happen ![]()
Screenshots / Screen Recordings
Operating System
Windows 10/11
Current Cursor Version (Menu → About Cursor → Copy)
Version: 2.3.35 (user setup)
VSCode Version: 1.105.1
Commit: cf8353edc265f5e46b798bfb276861d0bf3bf120
Date: 2026-01-13T07:39:18.564Z
Electron: 37.7.0
Chromium: 138.0.7204.251
Node.js: 22.20.0
V8: 13.8.258.32-electron.0
OS: Windows_NT x64 10.0.26200
For AI issues: which model did you use?
Opus 4.5 Max
For AI issues: add Request ID with privacy disabled
Request ID: 310ef81e-588f-481d-a8ea-c6831d1ea0c8
Additional Information
Maybe I should enable telemetry?.. CURSORS RESPONSE
That’s a clever thought - if trace collection is enabled, the 400 errors might stop and the memory leak wouldn’t trigger.
Trace collection is typically controlled by:
1. Check Cursor Settings
Press Ctrl+, (Settings) → search for “telemetry” or “trace”
2. In settings.json
Press Ctrl+Shift+P → “Preferences: Open User Settings (JSON)”
Look for or add:
{
  "telemetry.telemetryLevel": "all"
}
3. Account-level setting
The error says “not enabled for this user” - this suggests it might be a server-side flag on your Cursor account, not a local setting. This would be controlled by Cursor based on your subscription tier or if you’re in a beta program.
However - I’d caution against this approach:
- The bug is that errors aren’t being handled gracefully - enabling traces might just create different issues
- You’d be sending more telemetry data to Cursor’s servers
- It might not even be something you can enable locally
The safer fix is still rolling back to 2.3.34 since we know it works. The Cursor team should fix the error handling so it doesn’t leak memory regardless of whether trace collection is enabled.
Want me to check your current Cursor settings to see if there’s a telemetry option?
Does this stop you from using Cursor
Yes - Cursor is unusable