Agent stuck in "Planning...", "Generating..."

Where does the bug appear (feature/product)?

Cursor IDE

Describe the Bug

Agent gets constantly stuck in “Planning…”, “Generating…”, “Fetching…”

Steps to Reproduce

Work normally and at some point all Agent tabs will get stuck…and it’s sooooooo annoying.

Reloading the window or restarting extension host just unblocks the agent for a couple of messages until they get stuck again.

Expected Behavior

Agents don’t get stuck.

Screenshots / Screen Recordings

Operating System

MacOS

Version Information

Version: 2.4.28
VSCode Version: 1.105.1
Commit: f3f5cec40024283013878b50c4f9be4002e0b580
Date: 2026-02-03T00:56:18.293Z
Build Type: Stable
Release Track: Default
Electron: 39.2.7
Chromium: 142.0.7444.235
Node.js: 22.21.1
V8: 14.2.231.21-electron.0
OS: Darwin x64 24.6.0

Does this stop you from using Cursor

Yes - Cursor is unusable

Hey, thanks for the report. This is a known issue, there’s a big thread here: Planning next moves stuck.

The team is aware and tracking it. For now, you can try a couple things:

  • Disable HTTP/2: App Settings CMD + , > search for “HTTP/2” > enable “Disable HTTP/2”. This helped some users.
  • Network diagnostics: Cursor Settings > Network > Run Diagnostics, then paste the results here.

Also, if it happens again, copy the Request ID (Chat context menu in the top right > Copy Request ID). That helps us track down the specific cause on our side.

Let me know how it goes.

There you go:

[2026-02-10T10:29:05.138Z] Host: api2.cursor.sh
[2026-02-10T10:29:05.138Z] Servers: 54.93.173.153,45.77.61.165
[2026-02-10T10:29:05.138Z] Resolved to 100.30.8.54 in 295ms
[2026-02-10T10:29:05.145Z] Resolved to 100.30.8.54 in 6ms
[2026-02-10T10:29:05.150Z] Resolved to 100.30.8.54 in 2ms
[2026-02-10T10:29:05.153Z] Resolved to 100.30.8.54 in 2ms
[2026-02-10T10:29:05.154Z] Host: api2.cursor.sh
[2026-02-10T10:29:05.154Z] Servers: system
[2026-02-10T10:29:05.154Z] Resolved to 100.30.8.54, 174.129.226.31, 100.52.59.113, 52.54.106.233, 54.211.10.77, 54.166.196.51, 44.217.233.100, 34.227.120.215 in 1ms
[2026-02-10T10:29:05.155Z] Resolved to 100.30.8.54, 174.129.226.31, 100.52.59.113, 52.54.106.233, 54.211.10.77, 54.166.196.51, 44.217.233.100, 34.227.120.215 in 0ms
[2026-02-10T10:29:05.155Z] Resolved to 100.30.8.54, 174.129.226.31, 100.52.59.113, 52.54.106.233, 54.211.10.77, 54.166.196.51, 44.217.233.100, 34.227.120.215 in 0ms
[2026-02-10T10:29:05.155Z] Resolved to 100.30.8.54, 174.129.226.31, 100.52.59.113, 52.54.106.233, 54.211.10.77, 54.166.196.51, 44.217.233.100, 34.227.120.215 in 0ms
[2026-02-10T10:29:05.155Z] Result: true

[2026-02-10T10:29:04.842Z] Start
[2026-02-10T10:29:05.908Z] URL: https://api2.cursor.sh/
[2026-02-10T10:29:05.908Z] Status: 200
[2026-02-10T10:29:05.908Z] IP: 100.30.8.54
[2026-02-10T10:29:05.908Z] Issuer: C=US; O=Amazon; CN=Amazon RSA 2048 M01
[2026-02-10T10:29:05.908Z] Name: api2.cursor.sh
[2026-02-10T10:29:05.908Z] AltName: DNS:api2.cursor.sh, DNS:prod.authentication.cursor.sh, DNS:*.api2.cursor.sh
[2026-02-10T10:29:05.908Z] DNS Time: 5ms
[2026-02-10T10:29:05.908Z] Connect Time: 291ms
[2026-02-10T10:29:05.908Z] TLS Time: 622ms
[2026-02-10T10:29:05.908Z] Result: true in 1066ms

[2026-02-10T10:29:04.842Z] Start
[2026-02-10T10:29:05.687Z] Result: true

[2026-02-10T10:29:04.843Z] Sending ping 1
[2026-02-10T10:29:05.976Z] Response: ‘ping’ in 1133ms
[2026-02-10T10:29:05.976Z] Sending ping 2
[2026-02-10T10:29:06.816Z] Response: ‘ping’ in 840ms
[2026-02-10T10:29:06.816Z] Sending ping 3
[2026-02-10T10:29:07.760Z] Response: ‘ping’ in 944ms
[2026-02-10T10:29:07.760Z] Sending ping 4
[2026-02-10T10:29:08.635Z] Response: ‘ping’ in 875ms
[2026-02-10T10:29:08.635Z] Sending ping 5
[2026-02-10T10:29:09.485Z] Response: ‘ping’ in 850ms
[2026-02-10T10:29:09.485Z] Result: true

[2026-02-10T10:29:04.843Z] Starting streamSSE
[2026-02-10T10:29:05.977Z] Response: ‘foo’ in 1133ms
[2026-02-10T10:29:07.315Z] Response: ‘foo’ in 1338ms
[2026-02-10T10:29:07.969Z] Response: ‘foo’ in 654ms
[2026-02-10T10:29:09.003Z] Response: ‘foo’ in 1034ms
[2026-02-10T10:29:10.513Z] Response: ‘foo’ in 1510ms
[2026-02-10T10:29:10.973Z] Result: true

[2026-02-10T10:29:04.844Z] Starting stream
[2026-02-10T10:29:04.844Z] Pushing first message
[2026-02-10T10:29:06.125Z] Response: ‘foo’ in 1281ms
[2026-02-10T10:29:06.629Z] Pushing next message
[2026-02-10T10:29:07.689Z] Response: ‘foo’ in 1564ms
[2026-02-10T10:29:08.190Z] Pushing next message
[2026-02-10T10:29:09.189Z] Response: ‘foo’ in 1500ms
[2026-02-10T10:29:09.775Z] Pushing next message
[2026-02-10T10:29:10.926Z] Response: ‘foo’ in 1737ms
[2026-02-10T10:29:11.428Z] Pushing next message
[2026-02-10T10:29:12.460Z] Response: ‘foo’ in 1534ms
[2026-02-10T10:29:12.460Z] Result: true

[2026-02-10T10:29:04.841Z] Host: marketplace.cursorapi.com
[2026-02-10T10:29:06.051Z] Response in 1210ms
[2026-02-10T10:29:06.051Z] Response: 200
[2026-02-10T10:29:06.051Z] Response Type: cors
[2026-02-10T10:29:06.051Z] Server: null
[2026-02-10T10:29:06.051Z] Result: OK in 1210ms

The diagnostics look mostly fine. Everything passes, but the latency is noticeably high. That could make the issue worse, although the root cause is more likely on the server side.

A couple of questions:

  1. Have you tried disabling HTTP/2? (App Settings > CMD + , > search for “HTTP/2” > enable “Disable HTTP/2”). That’s the first thing to check.
  2. When the agent freezes again, can you send the Request ID? (In the chat, top right > context menu > Copy Request ID). This will help us find the exact request on our side.

The team is aware of this issue.

Yes. I enabled that, and have also toggled between the 3 network options, and I’m on HTTP/1.0 now.

When the agent freezes again, can you send the Request ID? (In the chat, top right > context menu > Copy Request ID). This will help us find the exact request on our side.

I’ve got two Agents stuck right now, so here you go:

1.- 3047425f-e343-400f-a82e-d2bf47bcdfd9
2.- d260a240-d68d-42d9-81c7-7364dcffe336

It freezes ALL THE TIME….

Cursor is unusable.

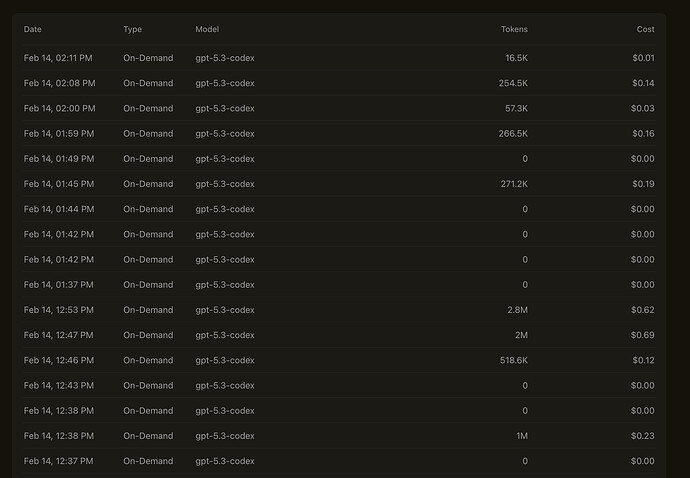
From these last 17 requests made, 8 failed….that’s almost 50% of failures.

That’s how unusable Cursor is

1 Like

Thanks for the Request IDs, I’ve passed them to the team.

This is a known issue we’re working on right now. High latency on your network (pings 850ms+) can make it worse, but the root cause is on the server side.

A couple things to check:

  1. You’re on version 2.4.28, please make sure you’re on the latest version (Help > Check for Updates). We’ve shipped fixes that might improve stability.
  2. Are you using a VPN or proxy? That could explain the high latency.

Let me know if updating helps at all.

Updated to Version: 2.4.37 (latest), and it’s the same issue.

And yeah, I’m on VPN, but when I disabled it the issue decreases its occurrences, but it’s not gone and I still have to rely on “Continue” for the model continuity.

Btw, if I didn’t say before, thank you for your hard work and sorry for being a pain in the ass. It’s just it’s extremely frustrating when I’m paying a high amount of money for using Cursor and I can’t even use it properly.

1 Like