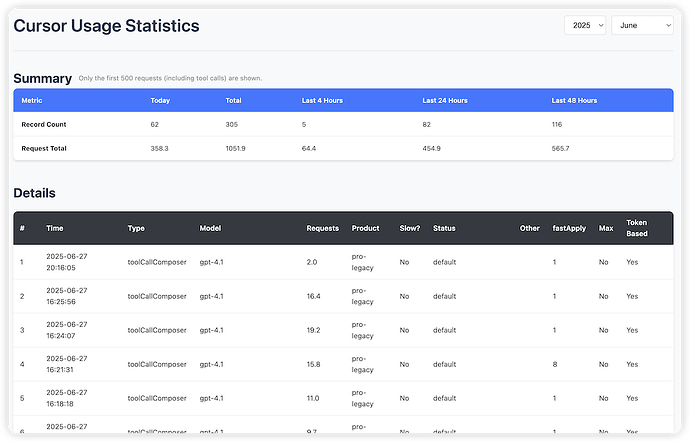
Hi everyone,
Like many of you, I’ve been closely following the discussions around Cursor’s new pricing and rate limits. To better understand how usage is calculated, I decided to do some digging and even built a tool to help. I wanted to share my findings, resources, and some suggestions for the Cursor team with the community.
Analyzing How Rate Limits Work
My investigation started when I found a Chrome extension called “Cursor Usage.” While this extension isn’t open source, its code is written in JavaScript. Even though it’s minified, I was able to analyze the logic with the help of Gemini to see how it calculates “local” and “burst” load. You can read my detailed breakdown here:
- Reddit Post: A Deep Dive into the Cursor Usage Chrome Extension
Based on that extension’s logic and the many user reports about hitting rate limits, I put together a post that attempts to explain the mechanics of what I call “usage debt” and how it might be affecting us.
The core idea is that once you hit the rate limit, you’re more likely to hit it again until after a significant cooldown period.
A Tool to See Your “Compute” Usage
While the “Cursor Usage” extension was a great starting point, I wanted a more direct way to see the underlying “compute” cost. I realized the key metric isn’t just request counts, but the priceCents value returned by the API for each request.
To make this visible, I created my own simple Chrome extension. It’s fully transparent—I’ve open-sourced not only the code but also the prompts I used to build it.
- GitHub (Code & Prompts): https://github.com/xiangz19/cursor_usage_detail
Here’s a look at what the extension’s output looks like:
If you’re hitting the rate limit, this tool can help. By sharing a screenshot of your compute usage over the last 4 and 24 hours, we as a community can get a much clearer picture of what’s causing the throttling.
Suggestions for the Cursor Team
Based on these findings, I believe a couple of enhancements would greatly improve the user experience. While it can feel like the rate-limiting details are being intentionally kept hidden, we ask that you at least implement the following two minimal requests to improve transparency:
- Display “Compute” Natively: Please enhance the dashboard to show our “compute” usage directly, so we don’t have to rely on third-party extensions to understand our consumption.
- Implement Usage Warnings: It would be incredibly helpful to receive a warning when we’re approaching our “local” usage limit. This would prevent the sudden surprise of being rate-limited when the “burst” allowance is also exhausted.
My Personal Experience with the New Pricing
So far, I haven’t hit the rate limit myself. For context, under the old plan, my 500 requests would typically last about three weeks, as I was quite conservative with my usage.
I’ve found the new compute-based pricing to be more flexible. I feel freer to use more powerful models like Opus or Sonnet Max when needed. I can now interrupt the AI, ask follow-up questions, or use different models like Gemini without worrying about “wasting” a full request.
However, it’s clear this new system isn’t for everyone. If you consistently hit the rate limit, enabling usage-based billing could become much more expensive than the old plan.
I hope these tools and analyses are helpful to the community. Let’s work together to better understand how this new system works!

