Instead of immediately generating a fix, the agent reads your codebase, generates multiple hypotheses about what’s wrong, and instruments your code with logging statements. You reproduce the bug, the agent analyzes the runtime data, and proposes a targeted fix. Then you verify it actually works.
The result is precise two or three line fixes instead of hundreds of lines of speculative code.
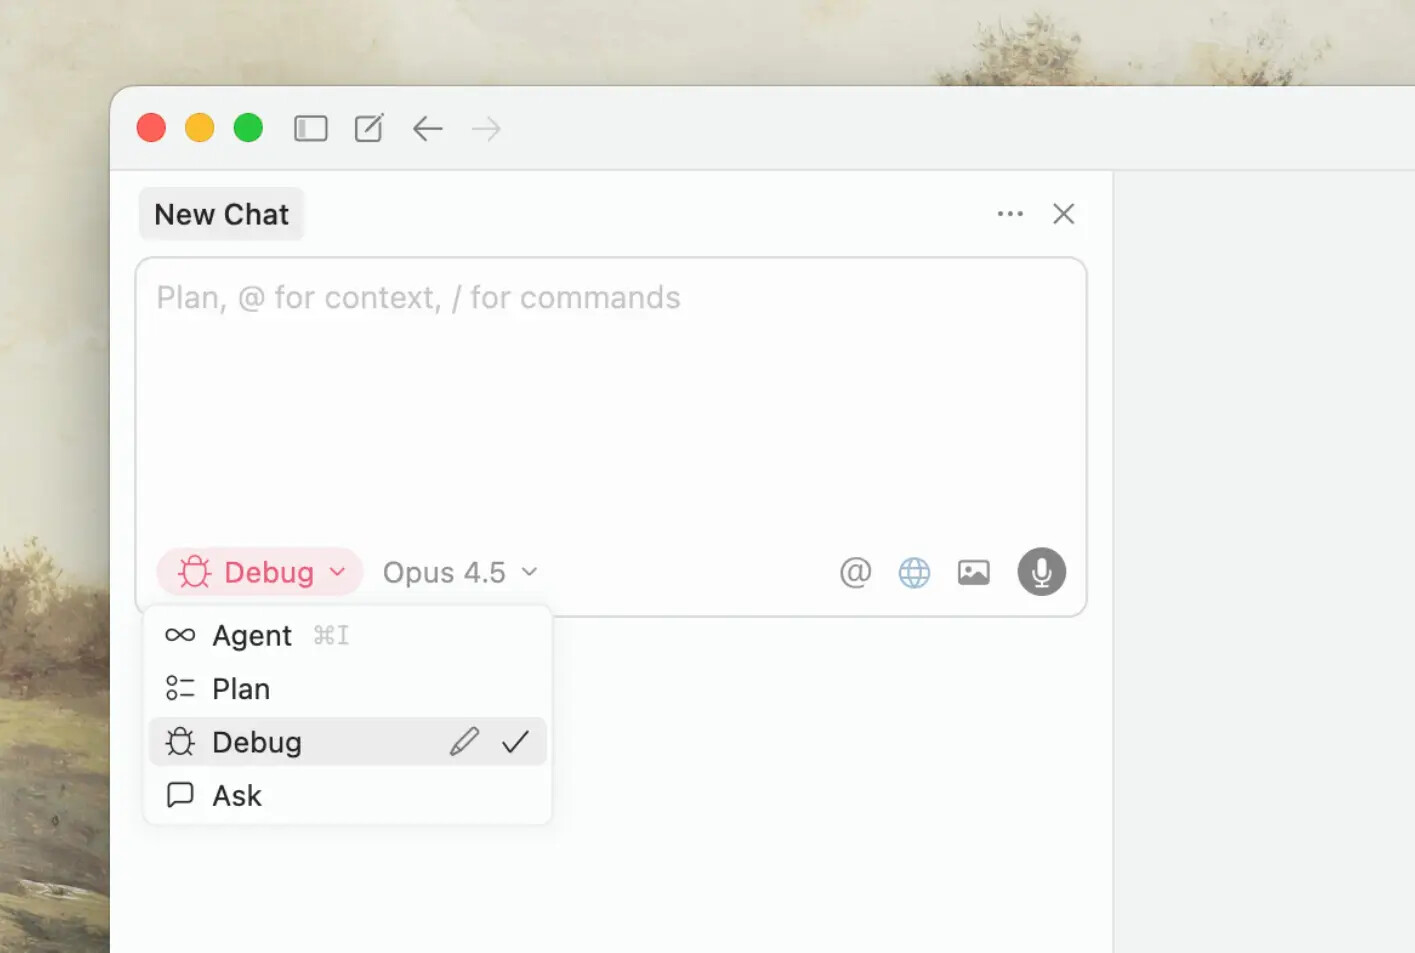
Describe the bug - Select Debug Mode and describe the issue. The agent generates hypotheses and adds logging.
Reproduce the bug - Trigger the bug while the agent collects runtime data (variable states, execution paths, timing).
Verify the fix - Test the proposed fix. If it works, the agent removes instrumentation. If not, it refines and tries again.
We’d love your feedback!
Did Debug Mode solve a bug that Agent Mode couldn’t?
How did the hypothesis generation and logging work for you?
What would make Debug Mode more useful?
If you’ve found a bug, please post it in Bug Reports instead, so we can track and address it properly, but also feel free to drop a link to it in this thread for visibility.
I normally ■■■■■ about things are bugging and not working and loops etc….
I was about to go crazy today spent about 150usd sorting something with Opus 4.5 going loops and just messing up code constantly, every mode etc… Then an update comes to Cursor I update and see this new Debug function… And now 30-60 minutes later, problem solved ! Was a charm to use it!
Thank god I love it, I love the approach it takes! I really love it. Please do not mess it up!
In the announcement, it is mentioned debug mode can see variable values etc, but as far as I can see all it does is add print statements, it does not set breakpoints and none of the fancy stuff? There is an MCP extension for that, sad to see this not being native in cursor. Or am I wrong?
However, I struggled with a single point where it could have been a even special moment while trying to use it for the first time: The Debug agent added instrumentation code that tried to use 127.0.0.1 inside the Android emulator instead of 10.0.2.2, causing connectivity failures.
So, somehow, it would be great to have better environment awareness
I love this! It is a huge upgrade to the manual version of this (ask for logging, paste logging or chrome MCP to read console, etc…, then ask to clean up logging). I assume you have some prompt steering too as the agent was following some great flows!
Cosmetic but major confusion point for a new user: “How do I stop debugging?”? I only see “Mark Fixed”. If I click that…will it just exit the mode and clean up or will it do something to remember the issue is solved? Since I did not solve it, the later would be bad context.
My request (maybe?): If “Mark Fixed” really means “Stop Debugging & Clean-up”. Display a button label more to this effect.
I asked GPT-5.1 this question in-debug-mode-prompt and It says:
You don’t need to click “Mark fixed” to remove the debug logging, and since the issue is not fixed yet, you shouldn’t mark it fixed.
The logging is just the // #region agent log … fetch(…) snippets we added in your code.
Those will stay there until we explicitly remove them with another code change, regardless of whether you press “Mark fixed” in the UI.
Once we’ve actually fixed and verified the behavior, I’ll remove all those regions in a single cleanup patch; until then, leaving them in is exactly what this debug mode expects.
If you’d like, after we’re done fixing this, I can also do a quick sweep to ensure no stray debug logs remain anywhere in the repo.
For now I just clicked the normal “undo” button on the edited files and it removed all the debugging log and log file lines. If I had code changes that I didn’t accept it would have removed them so this isn’t ideal
My Request B: Add another button “Stop Debugging”…?
Aside from this UX issue, great work on this! I hope this helps.
From what I saw, in TypeScript, it added code in collapsed regions that logged messages and also streamed the data to a file it could read. It asked me to perform some steps (in my case, in my launch.json debug instance of chrome) and it could see all the generated data in the special file. Very cool! Much better for the agent than reading random console logs with all that wasted context!
I took this a step farther and told it what reproduction steps I wanted to take myself and asked it to track it. It gave me my own steps with the button to start. When I was done I told it what step failed and gave it a screen shot and we got to the heart of the issue in the next iteration.
Does Debug Mode cap its ability to plan and think? I never know whether to switch back to Agent Mode if I need it to think about something deeply or not.
If only Cursor hadn’t simultaneously broken my own debugging custom mode to force me to use their less thought-out and inferior solution…. Its progress for all those that had’nt already figured it out.. or dont know better. A slap in the face for the rest of us.
Useful Insight:
The Debug mode goes far beyond just finding issues. I now use it regularly to verify whether the implementation from Plan + Agent mode is correct. For me, Debug mode isn’t just about debugging—it has become an essential part of the workflow.
My current process looks like this:
Plan (for complex tasks) or Ask (for simple tasks)
Agent
Debug (to verify the previous implementation)
Debug mode is smart enough to review what was implemented and check everything thoroughly.
One limitation: when all hypotheses are confirmed as CORRECT, Debug mode exits without removing the instrumentation. This isn’t a big issue since I can simply ask to remove it via chat, but it would be faster to keep the quick action like “Mark as Fixed” (or another label as suggested earlier).
As a side effect of the AI being able to fully complete and verify tasks, I organically started using multiple agents in parallel. This works because the degree of attention required for each task is much lower now, and by removing waiting time (with AI doing the work), the overall speed has increased dramatically.
In short, Debug mode has evolved from being just a debugging tool to becoming a core part of the regular workflow. Because of its broader scope, I suggest renaming the Debug agent to something like:
Verify Agent
Validation Agent
These are just examples to illustrate the point—better naming is welcome (naming is hard!).
This is exciting! We recently published research on automated test generation with a very similar technical approach (https://concollmic.github.io/):
Instrument code with logging statements (language-agnostic)
Collect runtime execution traces
Use LLM agents with tools to analyze traces and generate solutions
Validate through concrete execution
It’s great to see this paradigm—“instrument → collect runtime data → LLM analysis → validation”—being validated in production debugging tools. The convergence suggests this is a powerful pattern for program analysis.