Cursor state.vscdb growing at 1 GB in a day

Where does the bug appear (feature/product)?

Somewhere else…

Describe the Bug

I’ve used Cursor for 2 months.
3 weeks ago, (about 20 Jan) state.vscdb was 5 GB
Yesterday morning (13 Feb, 10.00 am) state.vscdb was 7.27 GB
Yesterday evening (13 Feb, 10.00 am) state.vscdb was 8.20 GB
Growth of 1 GB in 12 hrs.
Is this something like a DOS attack or worse?

Steps to Reproduce

I don’t know

Expected Behavior

vscdb shouldnt grow at this rate. Soon I will be out of hard drive space and wont be able to use cursor.

Operating System

Windows 10/11

Version Information

Sorry wont get that. I’ve just updated to the latest before this.

Does this stop you from using Cursor

No - Cursor works, but with this issue

Hey, thanks for the report. 8 GB for state.vscdb is definitely not normal.

A few things that’ll help narrow this down:

  1. Which state.vscdb file is growing? The global one at %APPDATA%\Cursor\User\globalStorage\state.vscdb, or the one inside a specific workspace at %APPDATA%\Cursor\User\workspaceStorage\<id>\state.vscdb?
  2. Your exact Cursor version. Open Help > About and you’ll see it there.
  3. About how many workspaces or projects do you usually have open?

As a temporary workaround to free up space right now: fully close Cursor, then open the enlarged state.vscdb in any SQLite tool, like DB Browser for SQLite, and run:

VACUUM;

This will compact the database and reclaim unused space. You can also check which tables take up the most space, which will help us understand what’s causing the growth.

No need to worry about a DOS attack, it’s just an internal database that grew larger than it should. The team is aware of size issues and it’s on our radar. Send the details above and let me know how the VACUUM went.

Hi
I tried running “VACUUM;” on the state.vscdb and file size and table seemed to be exact the same size before and after. So this does not seem to be a solution. I am on 24gb now and my computer is starting to complain about disk space. So more potential solutions are welcome.

@deanrie - Forgot to mention you for the message above.

Hey, @Teglgaard 24 GB is way out of proportion. If VACUUM didn’t shrink the file, it means it’s actually full of data, not just fragmented.

To figure out what’s taking up all that space, please do this:

SELECT name, SUM(pgsize) as size_bytes 
FROM dbstat 
GROUP BY name 
ORDER BY size_bytes DESC 
LIMIT 10;

Also important, which state.vscdb is it exactly. The global one at %APPDATA%\Cursor\User\globalStorage\state.vscdb, or the one inside workspaceStorage\<some-id>\state.vscdb?

If you need free disk space right now, close Cursor, rename the file to state.vscdb.bak, and restart. Cursor will create a new file. Warning: if this is the global state.vscdb, renaming it can cause an infinite “Loading Chat…” in existing projects (known issue: Deleting global state.vscdb causes infinite 'Loading Chat' in projects, history not recoverable without corrupted backup). Your chats won’t be deleted (they’re in workspaceStorage), but they’ll be inaccessible until you restore the original file. Keep a backup.

Let me know what the request returns.

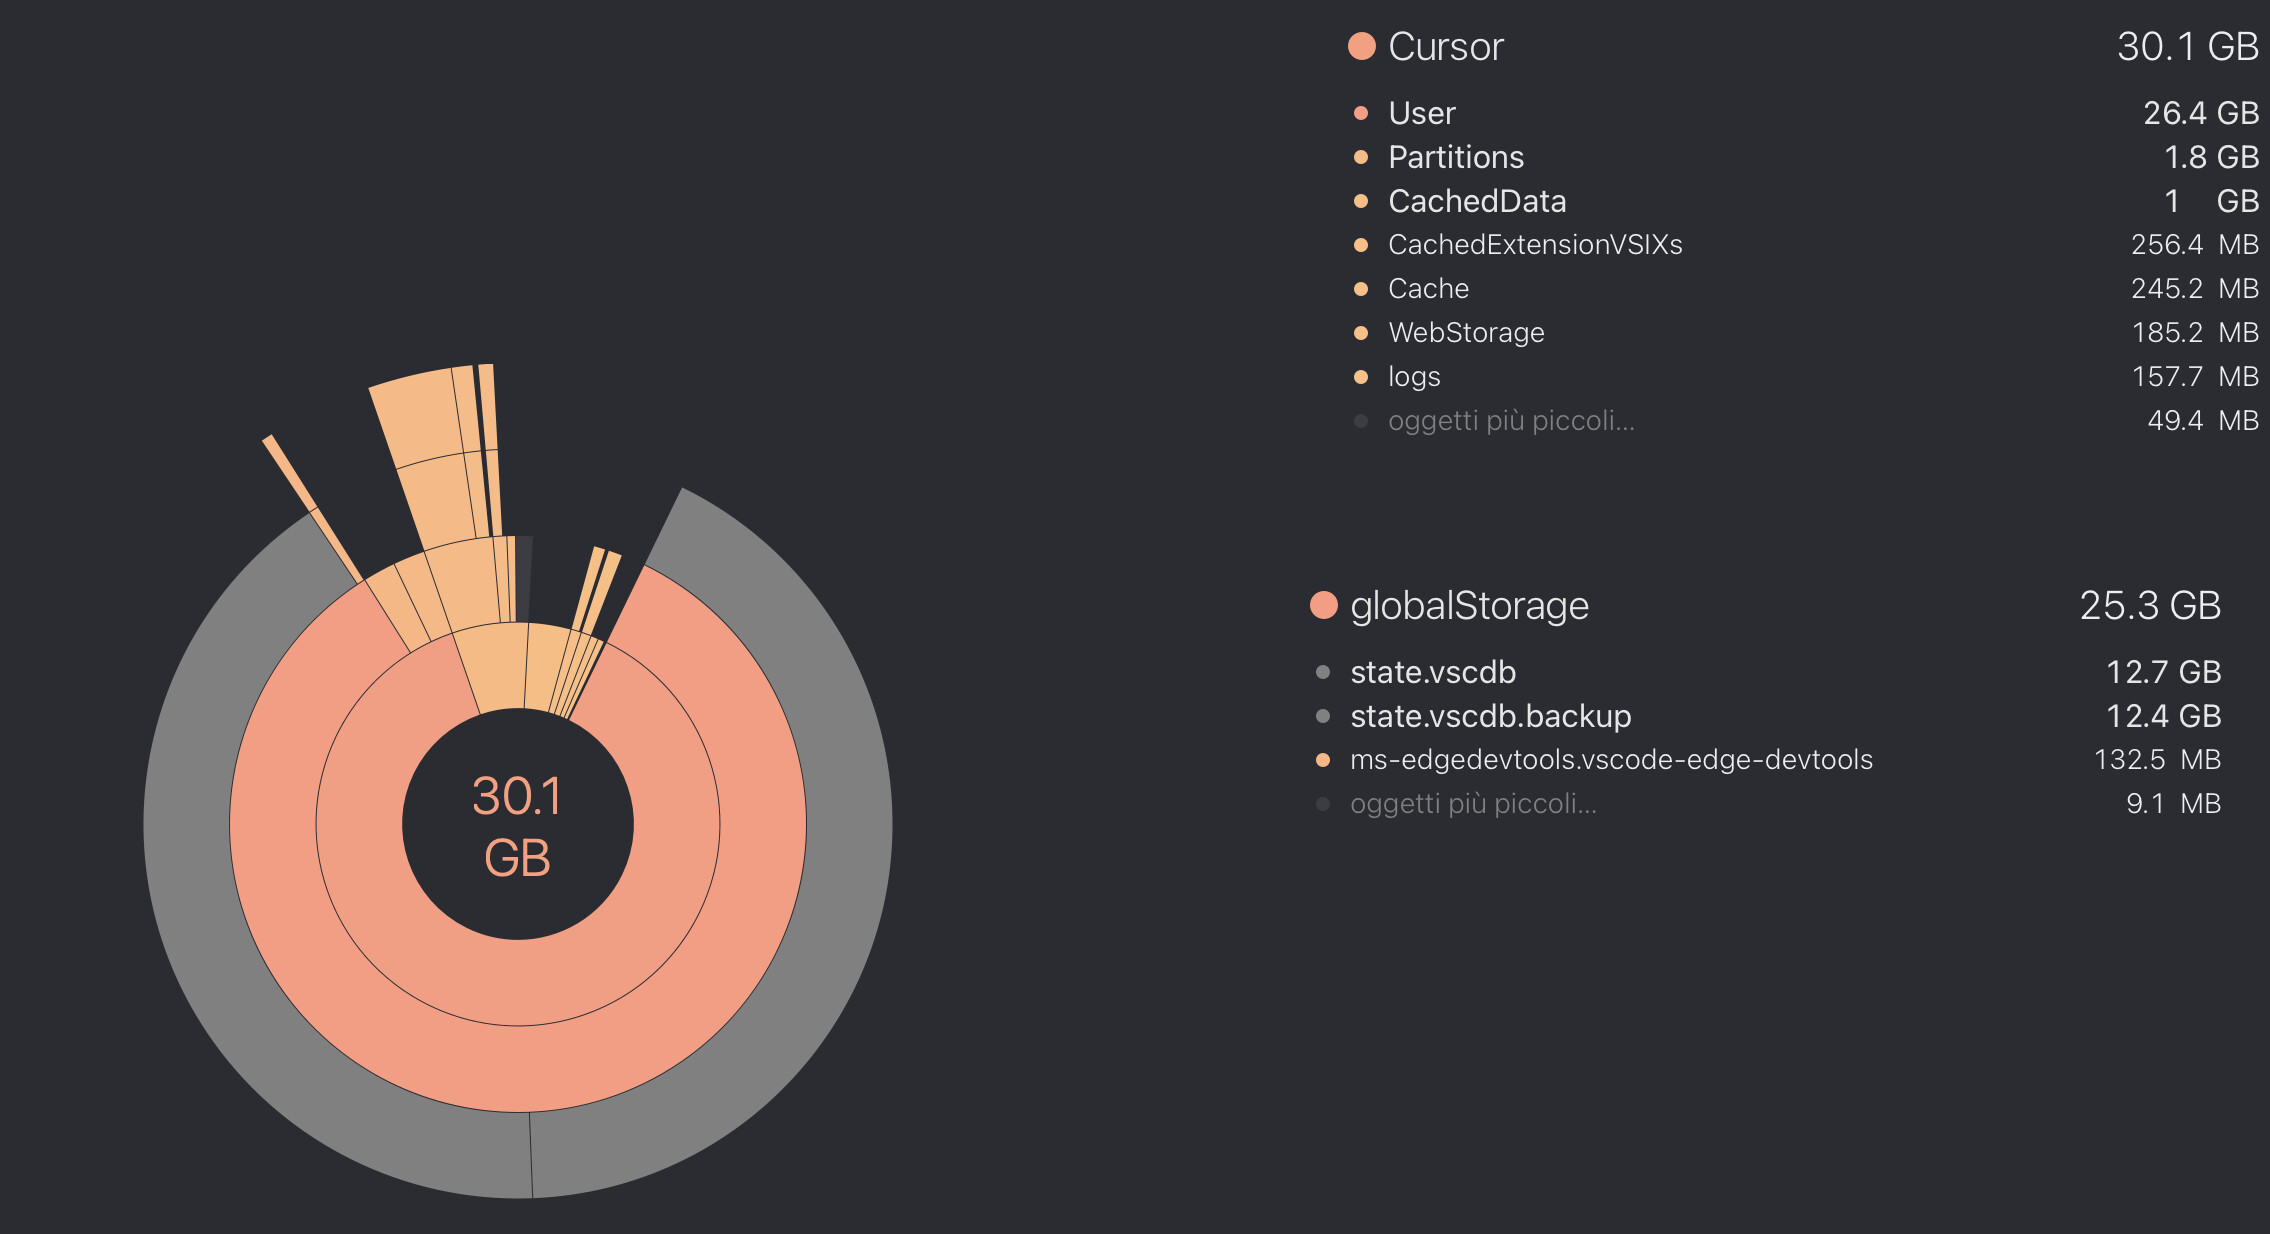
I also encountered high state.vscdb size at ~13.7GB. I havent’t definitively diagnosed cause, but I did recently start adding many cloned Git repos into my project filesystem under /repos/* weighing in at around 77GB (note, these were just git cloned, not git submodules). I didn’t have a .cursorignore for those initially and Cursor may have started indexing or doing something with those files? The symptoms leading me here was Cursor staying alive for around 10-15 minutes before crashing with error below. The crash often accompanied a CPU activity spike, but not always.

My attempt to cleanup follows, I’m monitoring for addition crashes presently (cleanup script collapsed below). This got the state.vscdb down to 23.8MB.

—-

I ran this on the global DB:
~/Library/Application Support/Cursor/User/globalStorage/state.vscdb

SELECT name, SUM(pgsize) AS size_bytes
FROM dbstatGROUP 
BY nameORDER 
BY size_bytes 
DESCLIMIT 10;

Result:

  • cursorDiskKV: 13,641,699,328 bytes
  • sqlite_autoindex_cursorDiskKV_1: 99,713,024 bytes
  • ItemTable: 5,296,128 bytes
  • sqlite_autoindex_ItemTable_1: 225,280 bytes

Counts:

  • cursorDiskKV rows: 976,000
  • ItemTable rows: 2,338

Integrity check:
PRAGMA integrity_check;
=> fails with “database disk image is malformed” and index errors (sqlite_autoindex_cursorDiskKV_1).

Sampling cursorDiskKV keys (first 20k rows) shows biggest prefixes are:
bubbleId, agentKv, checkpointId, messageRequestContext, codeBlockDiff.

So in my case the bloat is real payload growth in cursorDiskKV (not just fragmentation), and the backup DB also shows corruption signals.

I ran this script below to test if DB shrinking fixes, NOTE, this backs up the existing state.vscdb store, but “Loading Chat” will occur in all chats and has a known bug as above. Though full jsonl chat transcripts are available at ~/.cursor/projects//agent-transcripts//.jsonl and not lost.

Cleanup script
# Cursor state.vscdb cleanup + compaction (macOS)
# This removes the large cursorDiskKV payload families and shrinks the DB file.

set -euo pipefail

DB="$HOME/Library/Application Support/Cursor/User/globalStorage/state.vscdb"
DIR="$HOME/Library/Application Support/Cursor/User/globalStorage"
TS="$(date +%Y%m%dT%H%M%S)"

echo "Using DB: $DB"

# 1) Stop Cursor first (important to avoid lock/partial writes)
pkill -f '/Applications/Cursor.app/Contents/MacOS/Cursor' || true
pkill -f '/Applications/Cursor.app/Contents/Frameworks/Cursor Helper' || true
sleep 1

# 2) Backup
cp "$DB" "$DIR/state.vscdb.bak-precleanup-$TS"
echo "Backup created: $DIR/state.vscdb.bak-precleanup-$TS"

# 3) Delete biggest offenders (chat/composer/checkpoint blob families) + compact
sqlite3 "$DB" <<'SQL'
PRAGMA journal_mode=DELETE;
BEGIN IMMEDIATE;
DELETE FROM cursorDiskKV WHERE key LIKE 'agentKv:%';
DELETE FROM cursorDiskKV WHERE key LIKE 'bubbleId:%';
DELETE FROM cursorDiskKV WHERE key LIKE 'checkpointId:%';
COMMIT;
VACUUM;
PRAGMA wal_checkpoint(TRUNCATE);
SQL

# 4) Verify
echo
echo "Post-cleanup counts:"
sqlite3 "$DB" "
SELECT 'agentKv', COUNT(*) FROM cursorDiskKV WHERE key LIKE 'agentKv:%'
UNION ALL
SELECT 'bubbleId', COUNT(*) FROM cursorDiskKV WHERE key LIKE 'bubbleId:%'
UNION ALL
SELECT 'checkpointId', COUNT(*) FROM cursorDiskKV WHERE key LIKE 'checkpointId:%';
"

echo
echo "File sizes:"
ls -lh "$DB" "$DIR"/state.vscdb.bak-precleanup-"$TS"
stat -f '%N %z bytes' "$DB" "$DIR"/state.vscdb.bak-precleanup-"$TS"

There are related issues being reported in the last 24 hours. Seems like it could be a bug in Cursor sqlite usage for this store.

https://www.reddit.com/r/cursor/comments/1rkyfu9/super_crashy_recently/
https://x.com/yannschaub/status/2029387568056537266

The crashing behavior persists, I used Codex to profile memory and record high-res logs whilst Cursor went through 10-15 minute crash cycles, here are the findings.

Hopefully you can fix it soon, Cursor is unusable for me right now for any non-trivial agentic work, given it crashes within 15 minutes.

The Codex transcript is below, I have also attached the log files which record the failure scenario playing out. Let me know if I can provide any other supporting files!


Codex - GPT 5.3 Extra High analysis

cursor-crash-forum-logs-20260306.zip (137.2 KB)

I collected high-resolution logs/metrics and found a consistent crash signature that points to Cursor retrieval indexing (not DB size) as the immediate cause.

Environment

  • Version: 2.6.11
    VSCode Version: 1.105.1
    Commit: 8c95649f251a168cc4bb34c89531fae7db4bd990
    Date: 2026-03-03T18:57:48.001Z
    Build Type: Stable
    Release Track: Default
    Electron: 39.6.0
    Chromium: 142.0.7444.265
    Node.js: 22.22.0
    V8: 14.2.231.22-electron.0
    OS: Darwin arm64 25.0.0
  • Date of measured crashes: 2026-03-05
  • global state DB was already reduced; at crash time metrics show state_db_mb=22.7 (so this is not a “24 GB DB” event anymore)

Crash signature (repeats)

  • Renderer crash: “CodeWindow: renderer process gone (reason: crashed, code: 5)”
  • Example crashes:
    • /Users/rifont/Library/Application Support/Cursor/logs/20260305T231731/main.log:8 (23:27:36.836)
    • /Users/rifont/Library/Application Support/Cursor/logs/20260305T231731/main.log:16 (23:52:41.187)

Pre-crash process surge (from vitals monitor CSV)

  • /Users/rifont/Library/Application Support/Cursor/vitals-monitor/metrics.csv
  • Crash @ 23:27:36:
    • retrieval-always-local host (pid 63435): 393.8 MB @ 23:27:31 → 1451.2 MB @ 23:27:36, CPU ~142% just before jump
      • lines: 4007, 4021
    • renderer (pid 62909): 878.9 MB @ 23:27:31 → 1748.4 MB @ 23:27:36
      • lines: 4005, 4019
  • Crash @ 23:52:41:
    • retrieval-always-local host (pid 84051): 307.9 MB → 1493.2 MB with CPU 127.5%
      • line: 6172 (23:52:38)
    • then renderer crashes ~3s later (main.log line 16)

Needle in haystack (likely trigger patterns)

  1. Huge watcher/event expansion in retrieval grep service
  • /Users/rifont/Library/Application Support/Cursor/logs/20260305T162948/window8/exthost/anysphere.cursor-retrieval/Cursor Grep Service.log
  • “expanded 1 directories into 1007872 file events” (line 29)
  • then “found 9637 pending documents; triggering a reset” (line 34)
  • then “FORCE resetting index” (line 36)
  1. Path-normalization/hash retry storm in retrieval indexing
  • /Users/rifont/Library/Application Support/Cursor/logs/20260305T162948/window9/exthost/anysphere.cursor-retrieval/Cursor Indexing & Retrieval.log
  • hundreds of repeated:
    • fatal: could not open ‘/Users/rifont/git/tau/vscode/settings.json’
    • command repeatedly runs git hash-object ... /vscode/settings.json ... (missing leading dot)
  • starts around line 33 and continues through line 216
  • similar malformed-path misses also seen for oxlintrc.json / github/workflows/ci.yml in other windows (missing leading dot variants)
  1. HEAD-change correlation right before crash
  • /Users/rifont/Library/Application Support/Cursor/logs/20260305T231731/window1/exthost/anysphere.cursor-retrieval/Cursor Grep Service.log
    • 23:27:34.986 “git head changed …”
    • crash at 23:27:36.836 (~2s later)

Why I think this is the bug

  • The largest immediate RSS spike is consistently in retrieval-always-local extension host.
  • Renderer memory then spikes and dies with code 5.
  • This still happens after state.vscdb was shrunk, so current crash is runtime indexing/watcher pressure, not DB file bloat.

Useful fix directions

  • Instrument/limit retrieval host memory + pending event queue.
  • Add hard backpressure/guardrails when watcher expansion is huge.
  • Fix path normalization (.vscode/settings.json vs vscode/settings.json, same for .oxlintrc.json, .github/...).
  • Prevent retry storms for repeatedly missing files.
  • Consider excluding .git/* internals from retrieval sync/hash churn.