Diminishing transparency in context usage indicator!

Where does the bug appear (feature/product)?

Cursor IDE

Describe the Bug

There seems to have been progressive loss of transparency in the context usage indicator in the prompt editor. It used to show at least the rules that were applied, however it no longer does. On top of that, for a 200k context window, Cursor shows 164k is now all that is available (Claude models in particular.)

Screenshot 2026-01-26 at 9.57.08 AM

This lack fo transparency is very frustrating. I have been having problems with the agent not following rules, and I now can no longer even see which rules have been applied. We have never been able to see WHY rules are applied (always, intelligently (and what intelligence!), globs, manually referenced, etc.)

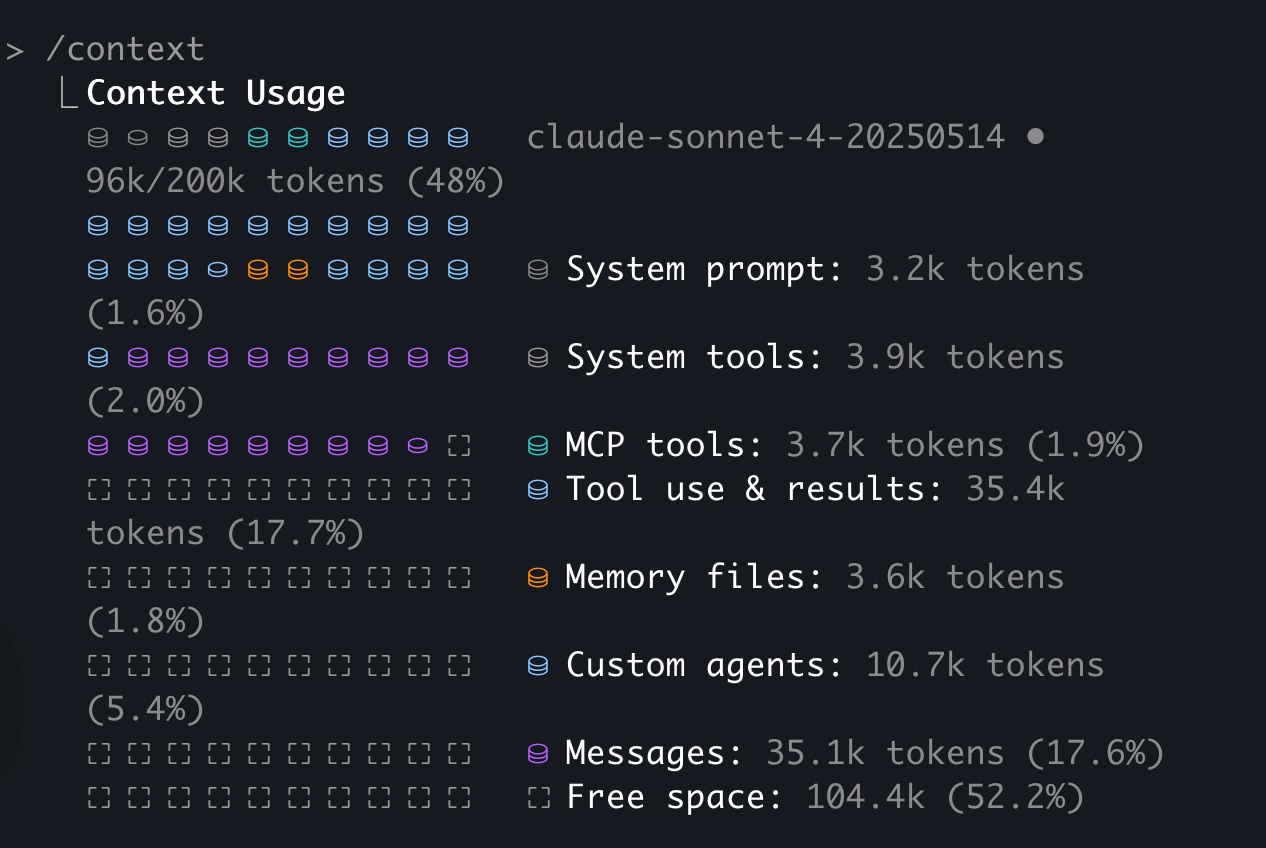
We need insight into how our context is being used. Claude Code offers a /context command. Cursor should not only make sure that the context usage indicator, actually indicates what rules are applied, but we really need a /context command as well so we can see EXACTLY what is using context and why. Cursor spends FAR too much time compressing context, even after just one prompt a lot of the time, when context should NOT be full. The fact that I only seem to get 164k out of the 200k that Claude models are suppose to provide, is also rather annoying. I don’t care if Cursor is using some of that context itself…I need to KNOW that, and how much, and WHY. To take away 36k worth of context token space is insane, when there is ZERO explanation as to why.

Steps to Reproduce

Check the context usage indicator in the prompt editor.

Expected Behavior

Context usage indicator displays rules used.
Context usage indicator should also indicate how much of the REAL context window (i.e. 200k, 270k, 1m, etc.) is used by Cursor.
A /context command should be made available so users can identify exactly what is using context, how much, and why, so they can optimize their usage as necessary.

Operating System

MacOS

Version Information

Version: 2.3.34
VSCode Version: 1.105.1
Commit: 643ba67cd252e2888e296dd0cf34a0c5d7625b90
Date: 2026-01-10T21:17:10.428Z
Electron: 37.7.0
Chromium: 138.0.7204.251
Node.js: 22.20.0
V8: 13.8.258.32-electron.0
OS: Darwin arm64 25.0.0

Does this stop you from using Cursor

No - Cursor works, but with this issue

3 Likes

Why was this moved to feature request? The loss of rule display in the context indicator is a bug, not a feature request. We HAD rule display for months, suddenly its gone. Additionally, the context window for the models I use most is 200k, but the indicator says it is only 164k (which is down from the previous buggy display of 176k just a few weeks ago). These are bugs. The lack of transparency overall, is a combination of bug and feature request, I guess, but the loss of detail and context window in the context usage indicator is definitely a bug.

1 Like

I think they lower the context to 164k to charge you the normal api cost plus their 20%, and if you want to really use the model as its intended to get used, then you need to activate the MAX Mode that doubles the cost ( or maybe that changed to ) that generates 120% profit. They need money

What version are you on? Since i am on Version: 2.5.0-pre.13.patch.0, it still showing Active Rules on it.

i think that Cursor its try move Rules into Skill right now. thats why there are command for migrate Rule into Skill.

Refernce:

Agent Skills | Cursor Docs

Screenshot:

I don’t care if its rules, skills, standardized definition files like AGENTS.md, etc. They should not only be showing ALL of it, but there should be a way to see what is using which amount of the available context space. They do not show what their own internal needs are, and they really should. What is their system prompt using, out of the FULL context window?

Some shady “you get 164k out of 200k for totally arbitrary reasons” is not reasonable. Its obfuscatory, hides what might really be going on, and quite frankly, why we first were limited to 176k, and now 164k, is utterly inexplanatory. Its arbitrary and annoying, if it is because of some bug in particular, and just blatantly shady if it is some backwards way of “getting their 20% off the top”.

They should be totally transparent on ALL of this. Right now they are being totally shady, sketchy and problematic.

I’m not sure that makes any sense. API cost is based on actual tokens used, whereas this is the maximum possible tokens you could use in each request. Knocking 20% off the max, doesn’t actually work to get them their 20%…

If you read studies about context usage, there are real problems when you use more than about 20-25% of the maximum context. So for Claude models, with a 1M real token context window, if you use more than 200-250k, then you are going to start dramatically increasing the changes of hallucination, which has been fairly well studied now. Hence the reason why its capped at 200k for non-max models in Cursor. In fact, it is also capped at 200k for Claude Code Sonnet and Opus models as well. You can use the full 1M context window with direct API usage, but again, the larger the context for a given request is, the greater the risk of hallucination.

So, I am not complaining about the context being limited to 200k. I am complaining about CURSOR operating off of a 164k context window, when the model states it has a 200k window. WHY? Why are they doing that? They don’t seem to do that for GPT models, as far as I can tell cursor operates with the full 272k window. Why are they screwing over users who use the Claude models?

Its FISHY! Shouldn’t be the case. If Cursor is using some of my context, then they should be TRANSPARENT about THAT. Its not a complaint about a 200k context, its a complaint about Cursor being shady about whatever they are doing with Claude context, and they seem to keep using more and more of the available window. Bothers me.

Could you share some examples of IDEs or CLIs that provide transparency regarding requests? I have been using OpenCode and the Claude Code CLI, but they do not show token usage or the context being used. I will pass this feedback to the Cursor team as it has a significant impact.

Claude Code CLI. Just type /context

Another thing I noticed Claude Code CLI does, is it actually gives you real-time feedback about how many tokens the current request is using. I am not sure exactly how they do that, but its interesting seeing it use 500tk → 800tk, → 1200tk, → 1700tk, etc. Mainly though, it is the /context command, which spits out a breakdown. This is a primitive example as I haven’t done much work yet and haven’t loaded any custom commands or anything into this project yet, but this is what Claude Code CLI will give you if you query /context usage:

Here is a better example. Just searched the web, this one shows more types of context usage and the way they break it down (this was from late spring last year I guess…they removed the percentages from the plot to the left, and only have them on the details to the right now, which I think is better):

Newer versions also will give you a breakdown of certain usages as well, such as. tool use, mcp, etc. So not only do you get the summaries, but you get some detailed breakdowns as well.

I would LOVE to see this in Cursor!

Example showing specific usage for sub agents, memories:

This is great, as it helps a dev like me, zero in on where context usage might be wasted. Especially if we could see a breakdown here, of ALL the rules applied, ALL the custom commands in play, ALL the skills in play, etc. If things are being injected into context, and using up what’s available, but I don’t really need them…

Cursor, right now, doesn’t even give me a way to see ALL the rules currently using context:

Assuming it shows any at all (seems to be a big, where sometimes it will, sometimes it will not), it only shows me some of them listed in the tooltip, but there is no way for me to see all 17 rules here. It just tells me there are 13 more, but gives zero insight. Further, just showing which, is kind of not enough. I don’t really know which of these, is using the most context, of all the rules that are attached. Since I can’t see the other 13, I don’t know what rules are attached that might not need to be, so I have no way to optimize my rule definitions (i.e. maybe take some off of “Always Apply” to maybe “Apply Intelligently”.) For things like Apply Intelligently, there is really no way to know if that even works for a given rule, or what changes might be necessary to get a rule to be applied intelligently when it should be….because we just have no insight into context usage details.

This was one of those MANY regressions with Cursor 2.0. Before Cursor 2.0, you guys showed all the rules as context attachment badges. So I knew ALL the rules that were attached to the context, and I could click in the badges to open them even. Now, I did not know how many tokens of my context the rules in total were using, or how many tokens each rule individually required. That would be VERY WELCOME insight, like what Claude Code CLI does above, in addition to being able to see EVERY rule that is applied listed out like the above example shows memories and sub agents.

Cursor 2.0, has cost your users a LOT with regards to the prompt and context insight, prompt tooling, clarity (i.e. which model you are using, is it thinking or non-thinking?), etc. This was really a major loss, and now we are at Cursor 2.4, and there seems to be no sign that any of these great features that were lost with Cursor 2.x will ever be restored. But they were important. Knowing what’s going on with Cursor’s agent, its context usage, etc. is important, and hopefully you guys can improve in this area.

1 Like