I’m using Cursor as usual, and after one or two hours, it takes up too much CPU percentage while I’m literally only opening one repository and doing nothing. This greatly impacts my computer’s performance, and I hope you can solve it.
Steps to Reproduce
Just open Cursor as usual
Do some requests on Cursor
Just to put your computer in idle mode, and wait for an hour or so, and you can reproduce this.
Expected Behavior
It really isn’t normal. The CPU percentage is 419% and it’s making my Mac very hot, even though I’m using a newest M4 Mac.
Operating System
MacOS
Current Cursor Version (Menu → About Cursor → Copy)
Hey, it’s possible that some process is excessively consuming your CPU/RAM resources. Could you check which processes are being used while Cursor is running?
Start by checking the built-in Activity Monitor, then use Process Explorer in Cursor itself. There’s also a chance the issue might be related to one or more extensions, so try launching with the flag cursor --disable-extensions. The issue might also be related to the specifics of the project, have you tried checking this in other projects?
It would be great if you could share the info and screenshots of the processes used.
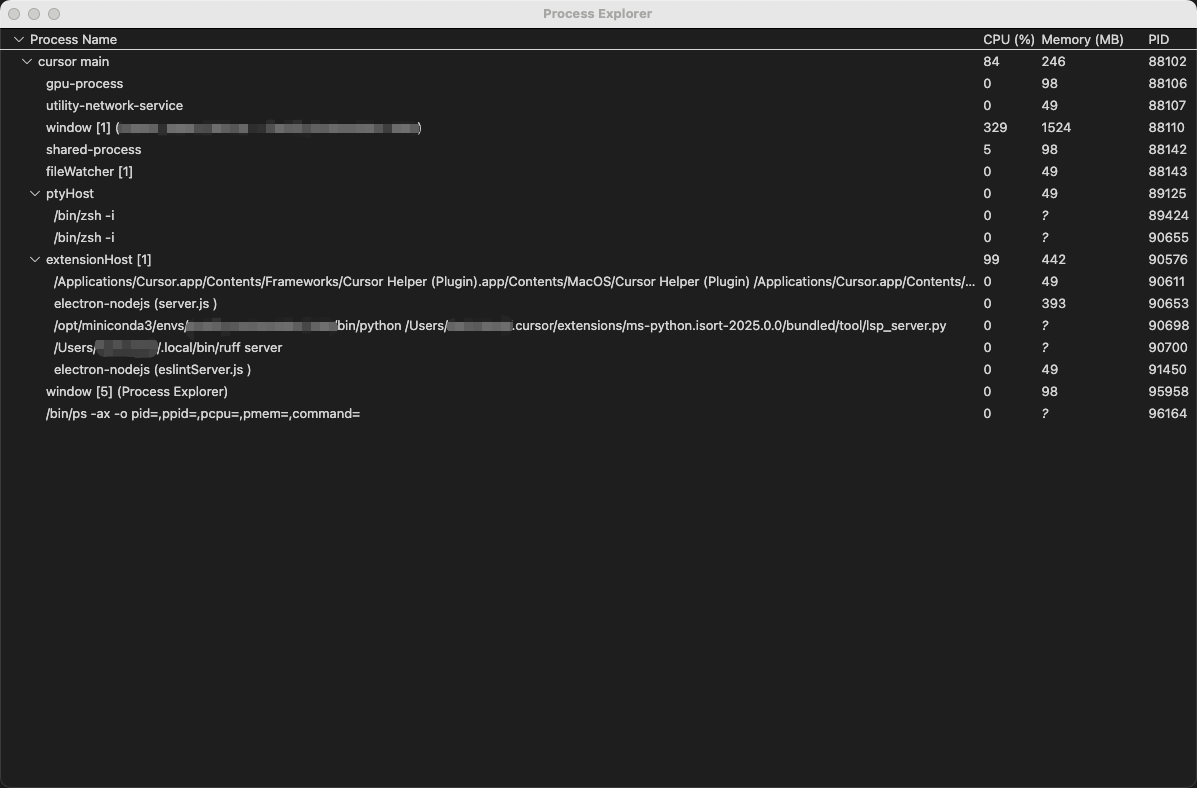
I have tried your solutions of using Process Explorer. And I found that the CPU consumption is gradually increasing after I’ve opened a certain python repo.
The following screenshot was the process consumption when I just opened the Cursor.
Thanks for the additional info. If this happens with one project, there might be something specific in it. Try restarting your computer, as there might be processes running in the background.
Also, try clearing some of the chat history, as this could also be the cause. Additionally, as a test, try renaming your project and opening it. If everything works fine, the chat history might have been the cause.
I just want to ask if there is any configuration for specific projects that I can set in Cursor. Since I know that this project has a lot of files, especially some data files, so it could be related to that. Cursor is analyzing some data file that I don’t want it to analyze.
Maybe I also try to see if it works in that way, but I want to see if this configuration is doable in Cursor. Is Cursor – Ignore files the thing for it?
Ignoring files is suitable for indexing, however, your issue might be related to an extension that analyzes your project. Try booting in safe mode using this command in the terminal: cursor --disable-extensions, and check if the issue persists.