Still using massive CPU

Where does the bug appear (feature/product)?

Cursor IDE

Describe the Bug

This has been happening for a few months now, cursor starts using 100s% of cpu. I disabled all vscode plugins. It’s cursor.

Steps to Reproduce

Run cursor on a mac, view activity monitor

Expected Behavior

It uses up the same amount of cpu as it used to, as other apps do. i.e. not 200%

Screenshots / Screen Recordings

Operating System

MacOS

Current Cursor Version (Menu → About Cursor → Copy)

Version: 1.4.3 (Universal)
VSCode Version: 1.99.3
Commit: e50823e9ded15fddfd743c7122b4724130c25df0
Date: 2025-08-08T17:34:53.060Z
Electron: 34.5.1
Chromium: 132.0.6834.210
Node.js: 20.19.0
V8: 13.2.152.41-electron.0
OS: Darwin x64 24.6.0

Additional Information

makes this less of a productivity gain when my machine becomes unstable. I am not the first to report this. Other have the same problem.

Does this stop you from using Cursor

Sometimes - I can sometimes use Cursor

hi @Omri and thank you for your bug report.

We have released several performance improvements in 1.4.4 and 1.4.5.
Currently we are releasing 1.5.0 (Early Access) with more improvements and it would be good to see if this also helps your usage.

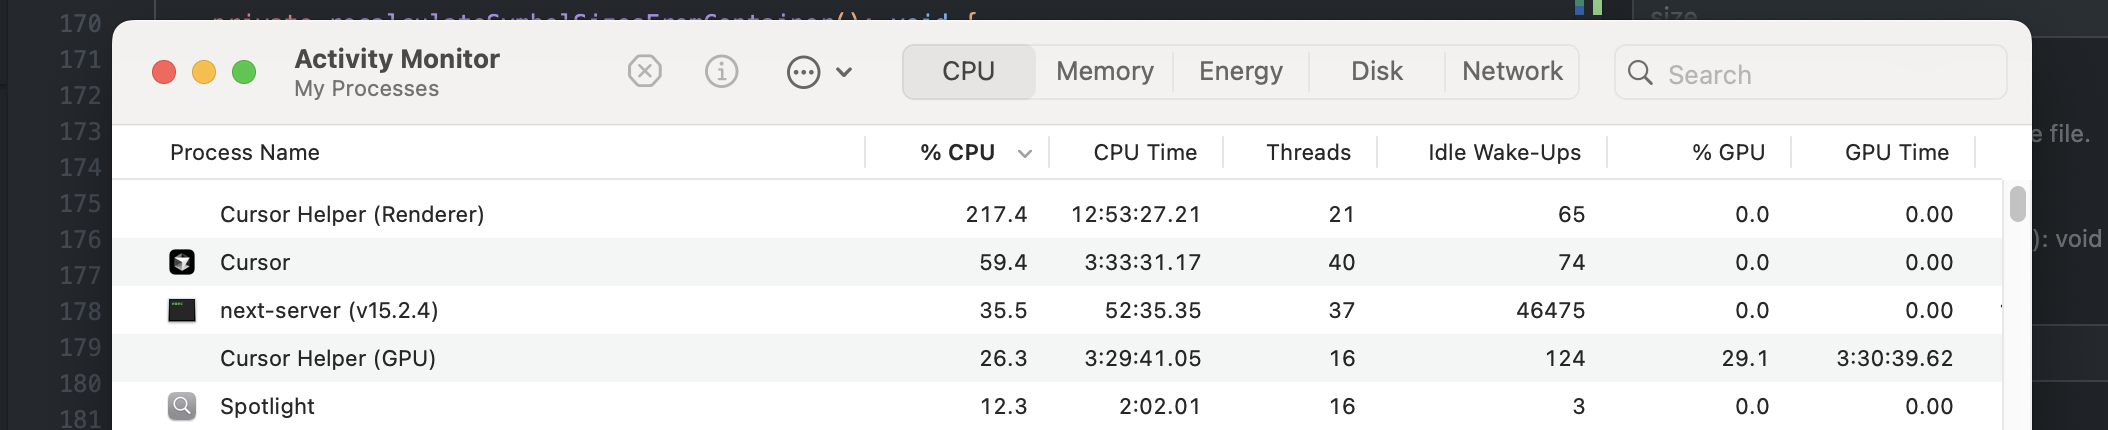
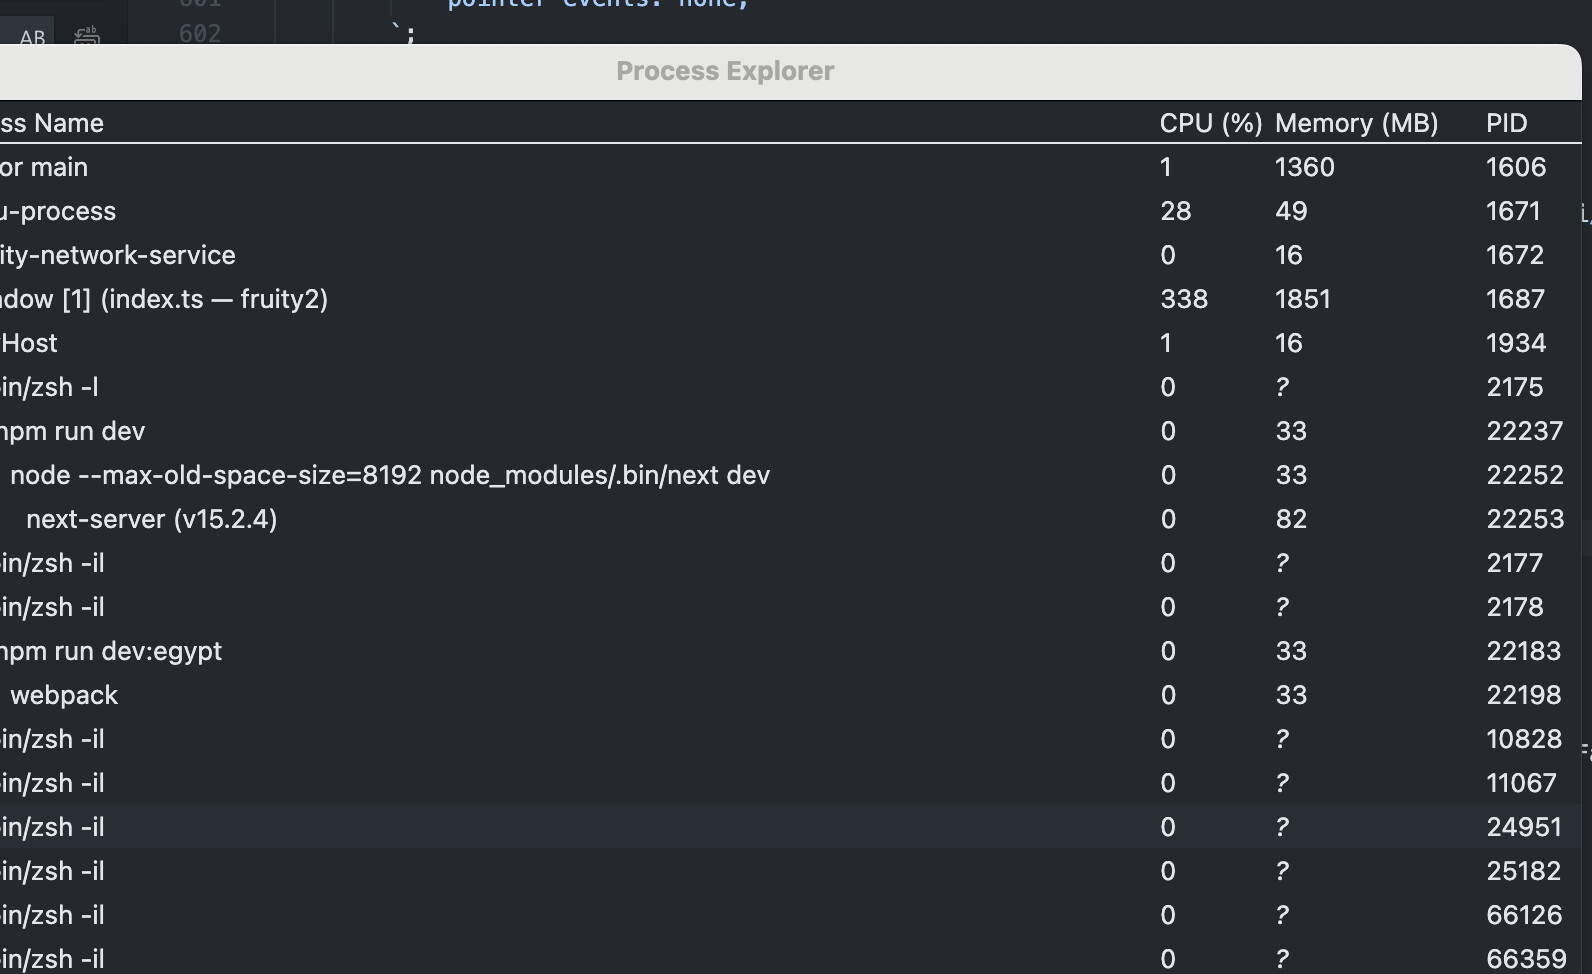
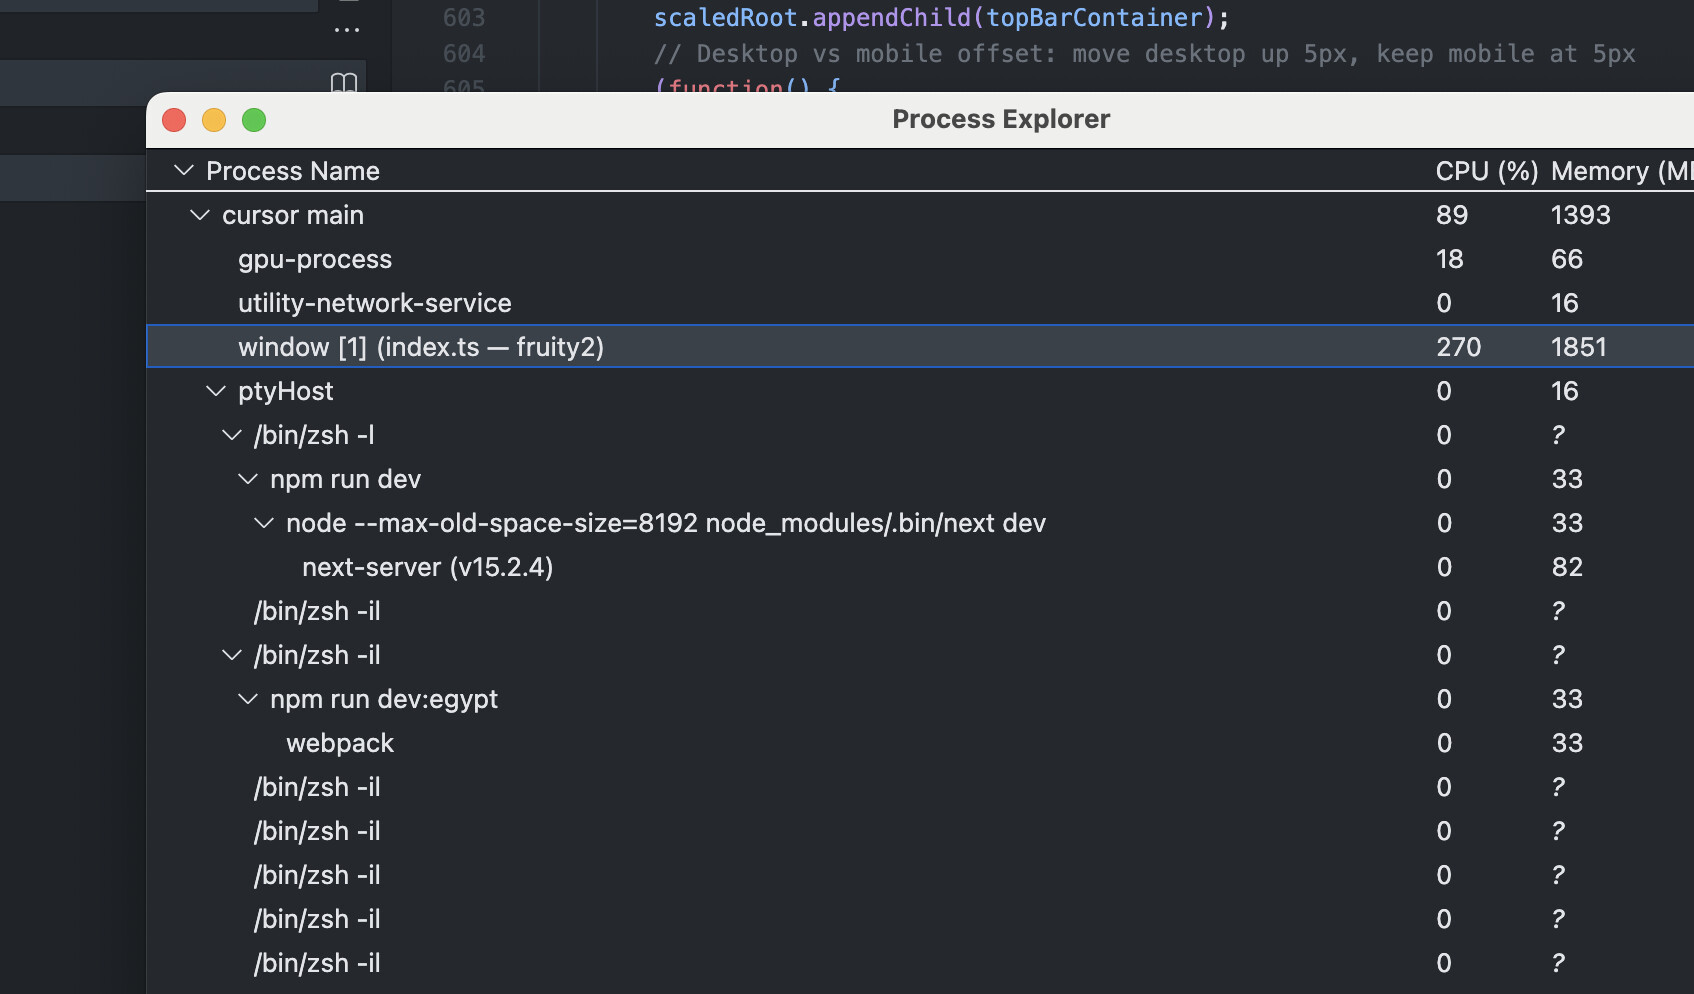
You can use Help > Process Explorer to see what is using so much CPU and post it here.
In many cases there are extensions or in terminal running processes consuming the CPU.

You can also try following:

  • You mentioned you disable extensions already. If you see it with latest version please try again cursor --disable-extensions and see if that changes something. If yes, then run with extensions and manually disable a few then restart.
  • Check if this happens with every project. e.g. try new empty project.
  • Verify if it occurs only when a specific file type is being edited.

Process explorer is not a mac thing I don’t think, it’s not showing on my help menu anyway.

I’m not 100% sure about this, but I think that when there are multiple edits to one file, or to multiple files queued up in cursor, that’s when the bad stuff starts

@Omri could you please check? I sent you the instructions that will work on Mac. Cursor has a Process Explorer and it shows which tabs and which extensions use how much CPU & Memory.

1 Like

Hey Condor, here are some illustrative screen grabs

index.ts is a 3,000 line file. Could do a with a little refactor, sure, but shouldn’t bring a 16gb machine to its knees !

Thank you for the screenshots. Its likely that parts of syntax highlighting and language server for TypeScript are causing the performance issue on the large file.

Could you update to 1.4.5+? It should have several performance improvements already which should help with your issue.

Additionally we are previewing today 1.5.0 that has additional improvements.

Yeah, it’s not the typescript syntax highlighting and language server, here is the same project when opened in VS code.

Could you try it with a new project? Another cause is a large or corrupted chat history.

I had all other chat tabs closed (am thinking the closed ones shouldn’t contribute to the fubar ?)

Will find time to do some more testing in a new project and keep incremental records of if / how the resource usage degrades over time.

It doesn’t feel like “just make a new project all the time” is a viable solution though, tbf

Its not meant as a workaround but to let us know what part of the app causes it so we can target checks on the right part of code.

Chat history != many open chats. A large history of chats causes or caused in certain versions performance issues which we improved.

If you need to keep your chats you can export them as backup using SpecStory extension, or manually through Chat UI.

1 Like

This topic was automatically closed 22 days after the last reply. New replies are no longer allowed.