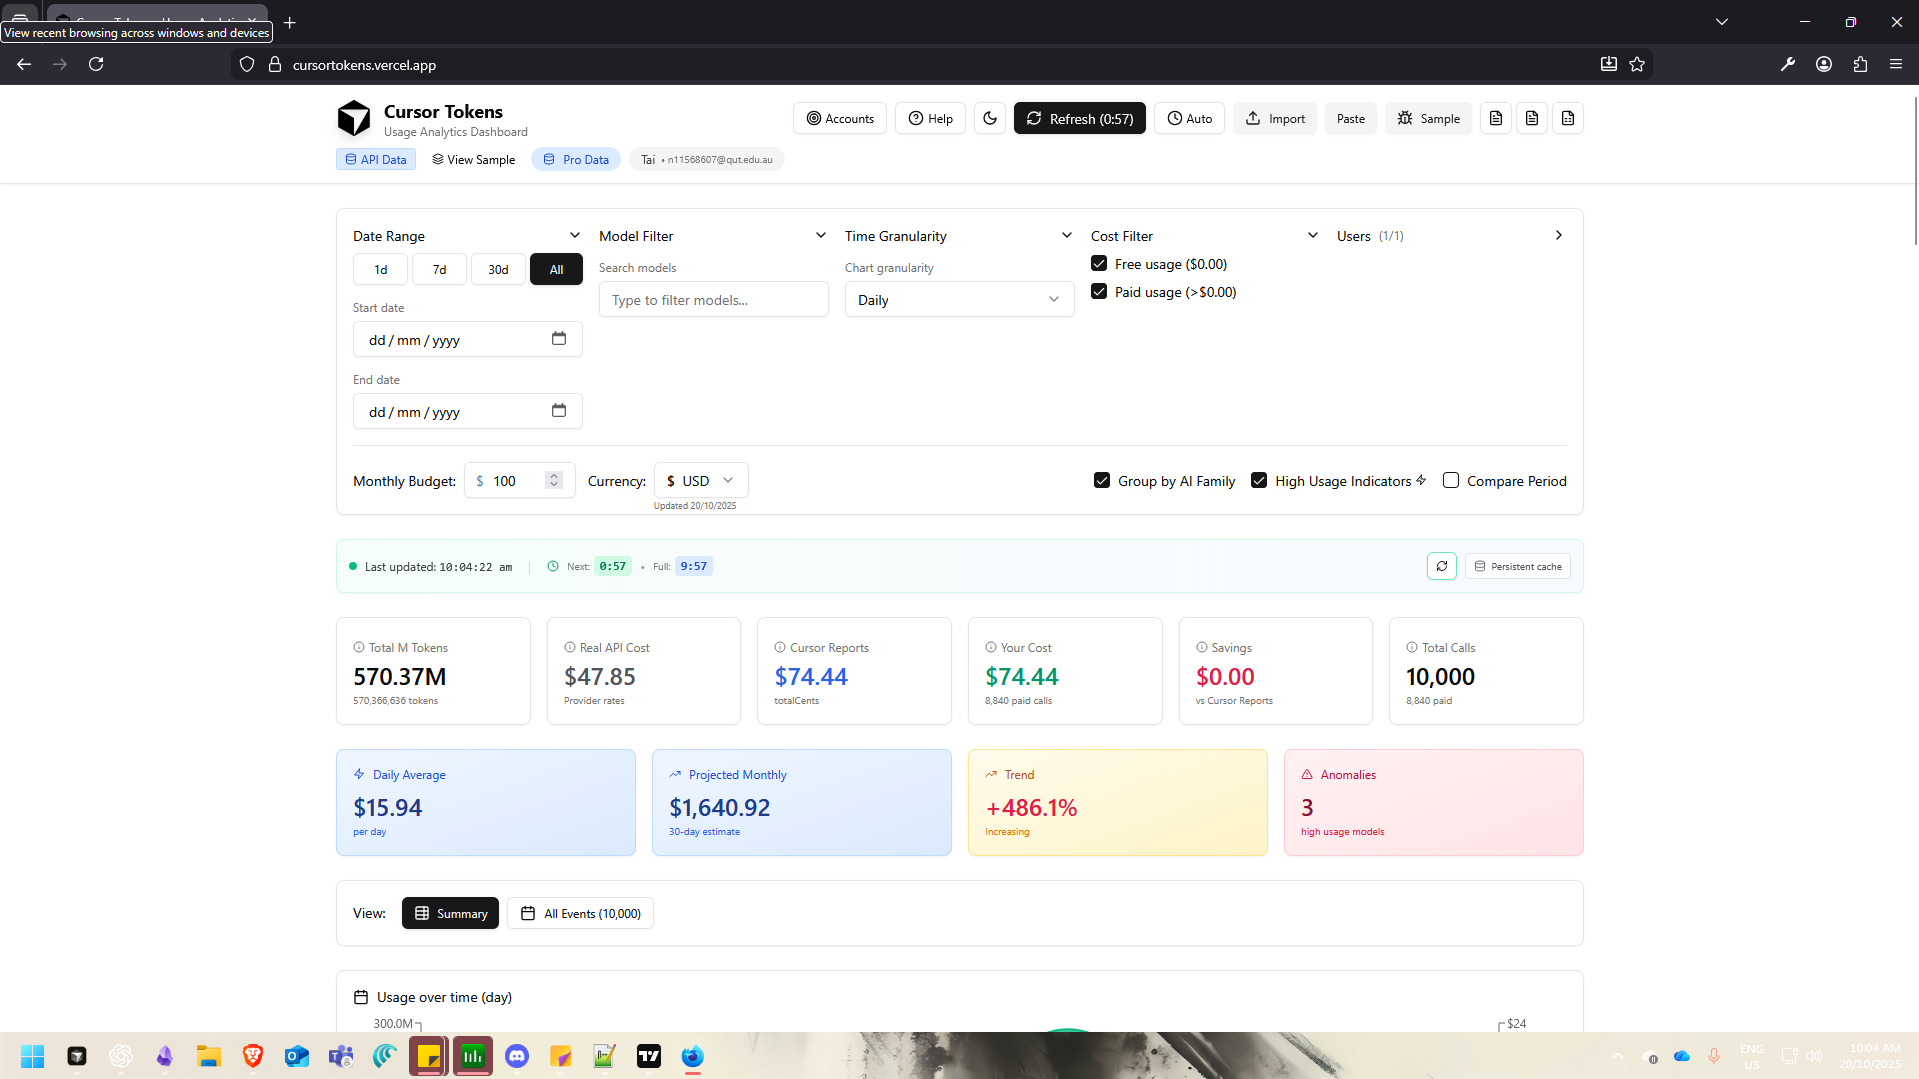
After Sept 15, I kept refreshing the dashboard trying to figure out if I’m about to blow through my limit or not. The dashboard has a limitation of 30 days but doesn’t actually answer:
Am I spending $20 this month or $200?
LOCAL CURRENCY CONVERSION???
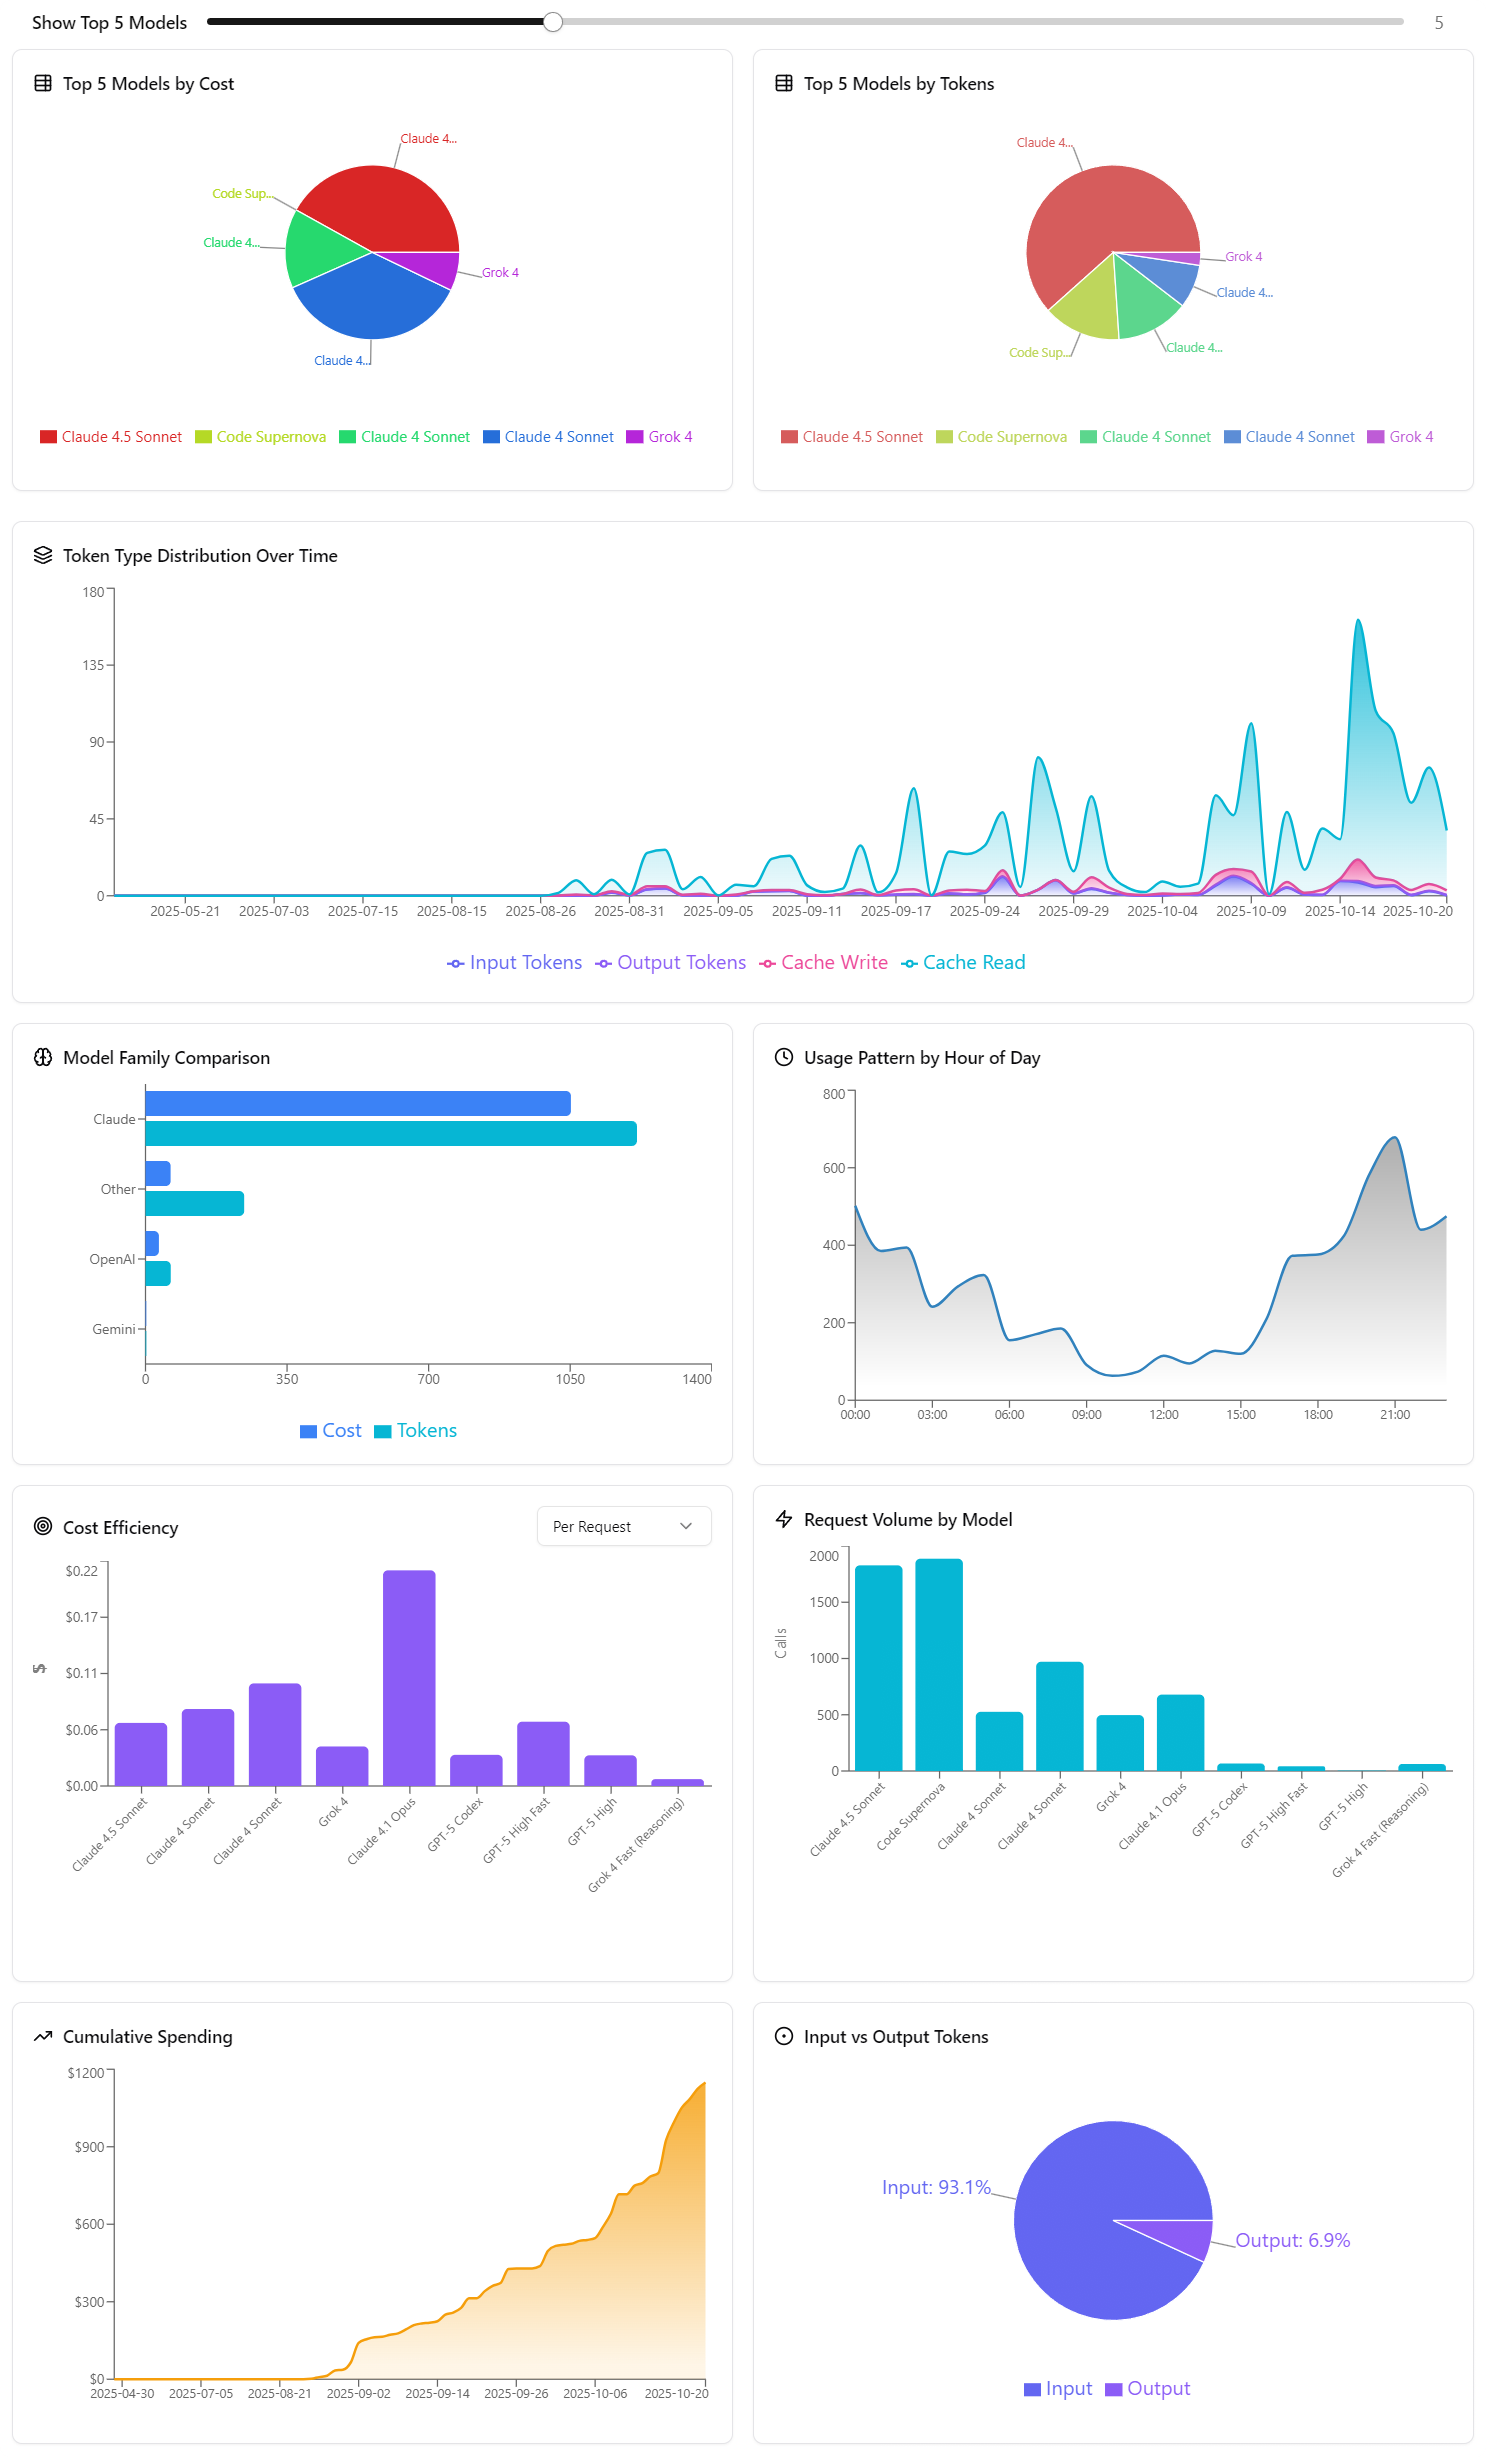
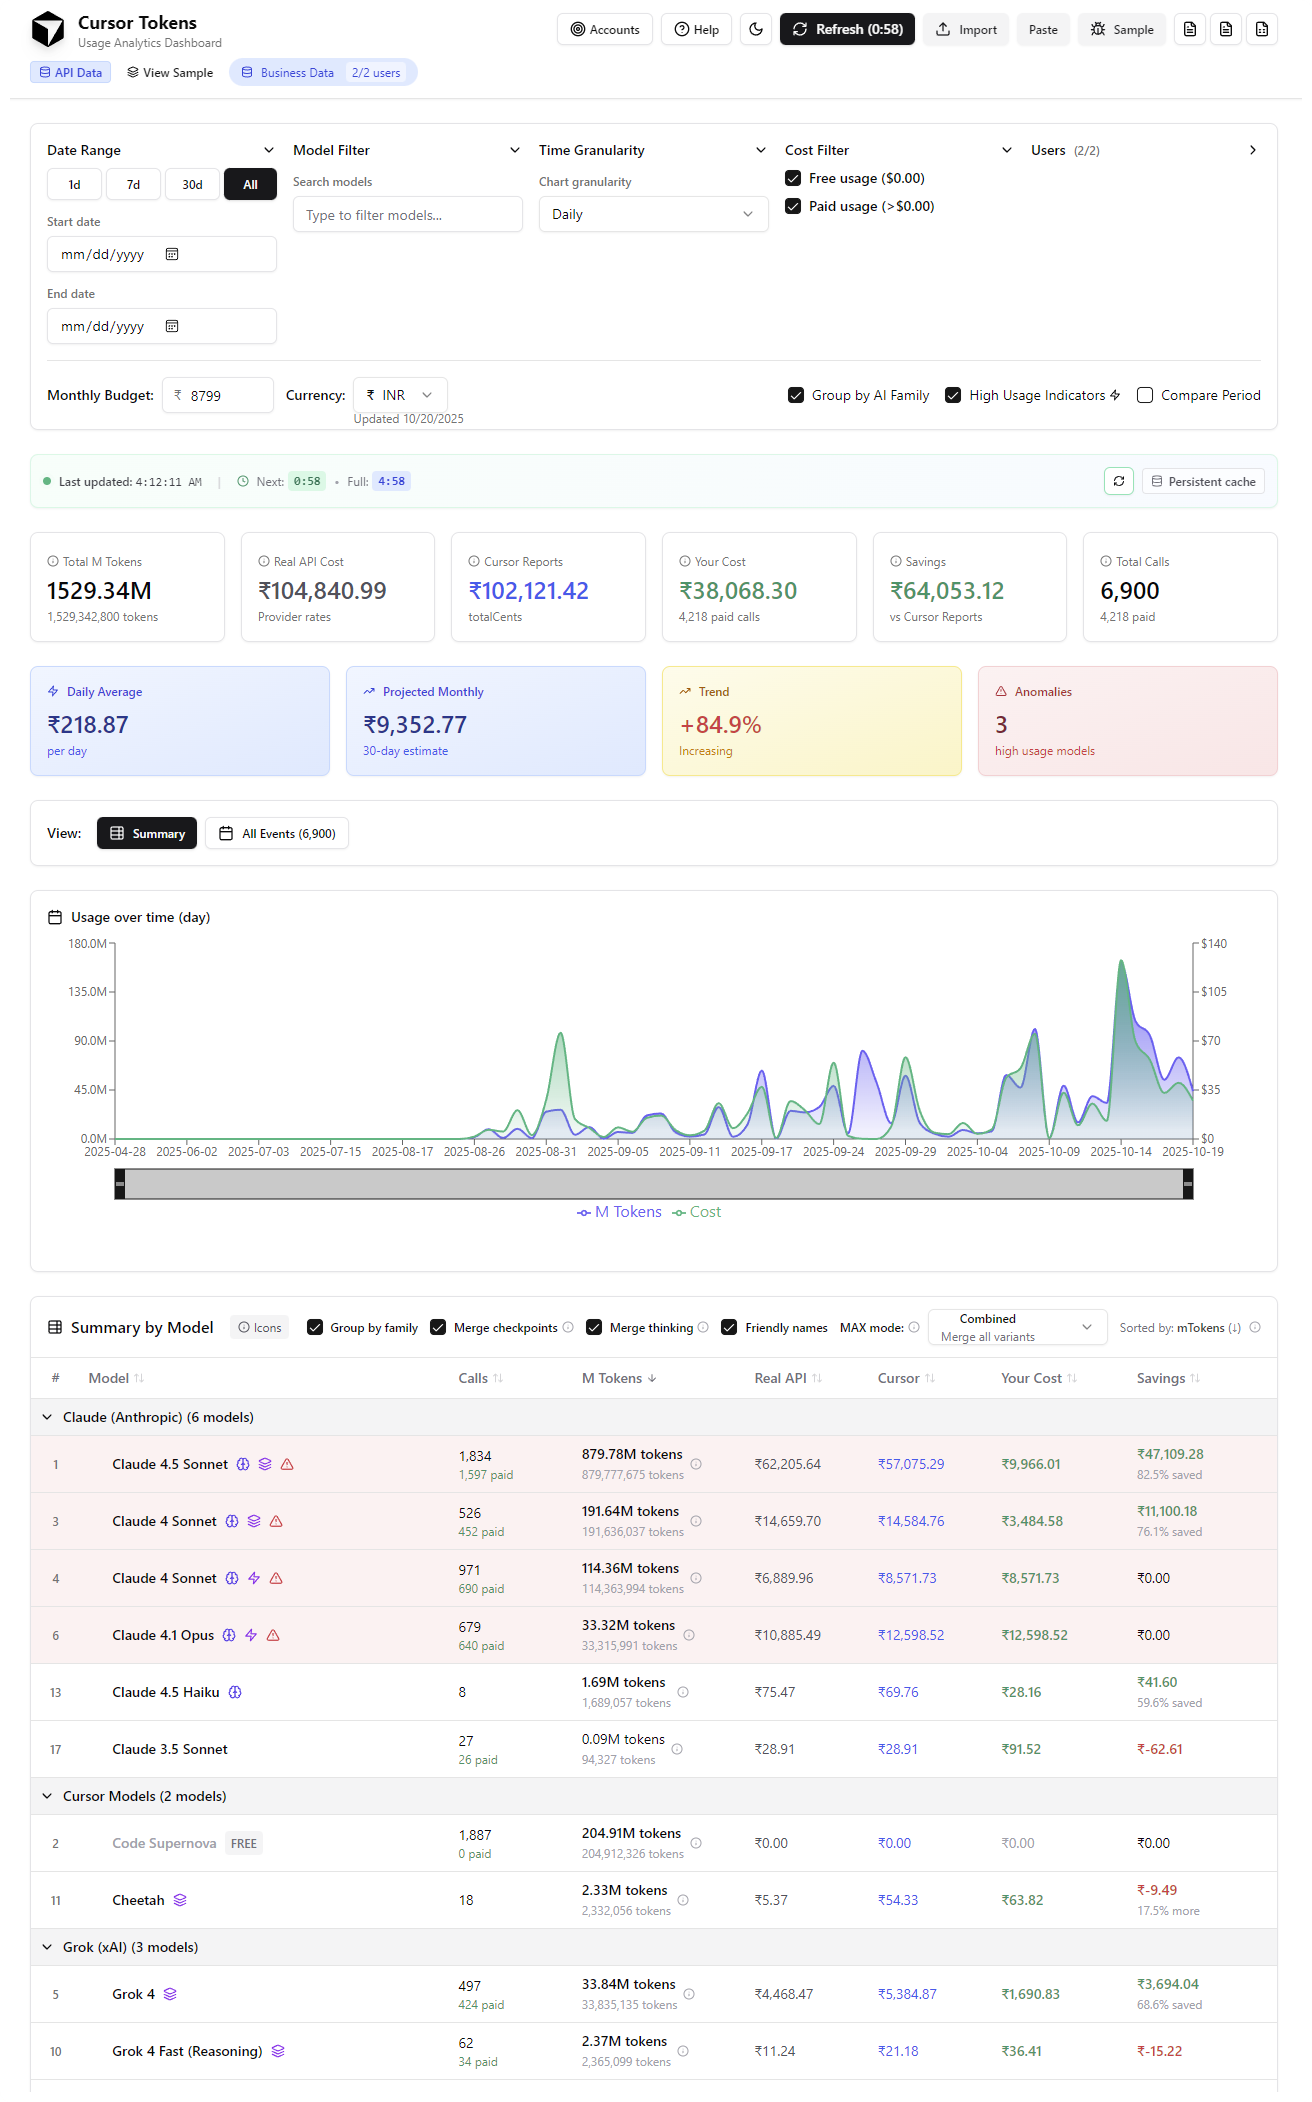
Which model is eating my budget? (Turns out Sonnet 4 is 80% of my costs)
This is personally what my metrics say, teams/business plan saves a lot of money. Or rather, the old legacy pricing. This is true for people on old pricing plan too.
Thanks for the feedback. For the data, press refresh twice so it will do a hard refresh. It aggressively caches so you don’t impact cursor’s API too heavily.
The range selector slider is a bit buggy, I am looking for better alternative to this.
I quickly added more charts that might be interesting to look at!
You’re hitting the arbitrary 10k limit I set. But I already made it handle cases like this, try hitting refresh twice to do a hard refresh and see if that fixes it. Otherwise what do your logs look like?
Ah. It’s because you’re on the old 10k page size still and got stuck there. Try again, reload the page (F5) and then do a hard refresh, you need to actually reload the page too. This should be fixed now, I pushed another change.
maybe it takes awhile to change, I retried on a different browser
console logs
``` Key state changed - dataSource: sample, sampleData: false (0), apiData: false (0), events: 0 2 index-BImp0crC.js:578:120397 Loaded sample data from cache: 7646 events index-BImp0crC.js:578:121346 Restored sample data view from last session index-BImp0crC.js:578:122128 Auto-fetch disabled (sample/manual import mode) index-BImp0crC.js:578:122385 Key state changed - dataSource: sample, sampleData: true (7646), apiData: false (0), events: 7646 index-BImp0crC.js:578:120397 Switching from sample to API mode - sample data will remain in memory index-BImp0crC.js:579:10695 Old cache cleared - fetching fresh API data index-BImp0crC.js:579:10848 Single press: triggering FAST incremental refresh (24h lookback) index-BImp0crC.js:579:11142 Skipping progressive refresh (transitioning from manual import to API data) index-BImp0crC.js:579:12031 Initial load (full history) index-BImp0crC.js:579:12582 Fetching from 1 account(s): 0 Business, 1 Pro (full history from 0)… index-BImp0crC.js:579:12643 Fetching Pro/Ultra data for “Taitranz” (full history)… index-BImp0crC.js:579:7458 Fetching profile for “Taitranz” (not cached)… index-BImp0crC.js:579:7881 Profile cached for “Taitranz” index-BImp0crC.js:579:8325 Fetching page 1 for “Taitranz” (pageSize: 10000)… index-BImp0crC.js:579:8633 Switching from sample to API mode - sample data will remain in memory index-BImp0crC.js:579:10695 Old cache cleared - fetching fresh API data index-BImp0crC.js:579:10848 Double-press detected: triggering FULL refresh from startDate: 0 index-BImp0crC.js:579:11037 Skipping progressive refresh (transitioning from manual import to API data) index-BImp0crC.js:579:12031 Full refresh (from startDate: 0) - catching all corrections index-BImp0crC.js:579:12381 Fetching from 1 account(s): 0 Business, 1 Pro (full history from 0)… index-BImp0crC.js:579:12643 Fetching Pro/Ultra data for “Taitranz” (full history)… index-BImp0crC.js:579:7458
✓ Using cached profile for “Taitranz” (0m old) index-BImp0crC.js:579:7706 Manual hard refresh - will re-learn optimal page size for “Taitranz” index-BImp0crC.js:579:8538 Fetching page 1 for “Taitranz” (pageSize: 10000)… index-BImp0crC.js:579:8633 Pro data for “Taitranz”: 10000 events fetched (full history) index-BImp0crC.js:579:10497 Total merged data: 10000 events from 1/1 accounts index-BImp0crC.js:579:15604 Cached to IndexedDB: 10000 events (4.47MB) index-BImp0crC.js:578:114252 Full refresh completed at 10:04:20 am index-BImp0crC.js:579:16998 This fetch was cancelled, skipping state update index-BImp0crC.js:579:17319 Pro data for “Taitranz”: 10000 events fetched (full history) index-BImp0crC.js:579:10497 Total merged data: 10000 events from 1/1 accounts index-BImp0crC.js:579:15604 Cached to IndexedDB: 10000 events (4.47MB) index-BImp0crC.js:578:114252 Full refresh completed at 10:04:22 am index-BImp0crC.js:579:16998 Setting API data directly: 10000 events index-BImp0crC.js:579:17507 setApiDataAndUpdate called with: 10000 events index-BImp0crC.js:578:120082 Successfully fetched and merged API data: 10000 events index-BImp0crC.js:579:17593 Key state changed - dataSource: api, sampleData: true (7646), apiData: true (10000), events: 10000 index-BImp0crC.js:578:120397 Single press: triggering FAST incremental refresh (24h lookback) index-BImp0crC.js:579:11142 Setting persisted API cache data directly: 10000 events index-BImp0crC.js:579:11646 setApiDataAndUpdate called with: 10000 events index-BImp0crC.js:578:120082 Loaded from persistent API cache: 10000 events (last updated 20s ago) index-BImp0crC.js:579:11765 Incremental refresh (last 24 hours) - fast updates index-BImp0crC.js:579:12494 Fetching from 1 account(s): 0 Business, 1 Pro (incremental: last 24h from 19/10/2025, 10:04:42 am)… index-BImp0crC.js:579:12643 Fetching Pro/Ultra data for “Taitranz” (incremental from 2025-10-19T00:04:42.088Z)… index-BImp0crC.js:579:7458
✓ Using cached profile for “Taitranz” (0m old) index-BImp0crC.js:579:7706 Fetching page 1 for “Taitranz” (pageSize: 10000)… index-BImp0crC.js:579:8633 Key state changed - dataSource: api, sampleData: true (7646), apiData: true (10000), events: 10000 index-BImp0crC.js:578:120397 Double-press detected: triggering FULL refresh from startDate: 0 index-BImp0crC.js:579:11037 Full refresh (from startDate: 0) - catching all corrections index-BImp0crC.js:579:12381 Fetching from 1 account(s): 0 Business, 1 Pro (full history from 0)… index-BImp0crC.js:579:12643 Fetching Pro/Ultra data for “Taitranz” (full history)… index-BImp0crC.js:579:7458
✓ Using cached profile for “Taitranz” (0m old) index-BImp0crC.js:579:7706 Manual hard refresh - will re-learn optimal page size for “Taitranz” index-BImp0crC.js:579:8538 Fetching page 1 for “Taitranz” (pageSize: 10000)… index-BImp0crC.js:579:8633 Double-press detected: triggering FULL refresh from startDate: 0 index-BImp0crC.js:579:11037 Full refresh (from startDate: 0) - catching all corrections index-BImp0crC.js:579:12381 Fetching from 1 account(s): 0 Business, 1 Pro (full history from 0)… index-BImp0crC.js:579:12643 Fetching Pro/Ultra data for “Taitranz” (full history)… index-BImp0crC.js:579:7458
✓ Using cached profile for “Taitranz” (0m old) index-BImp0crC.js:579:7706 Manual hard refresh - will re-learn optimal page size for “Taitranz” index-BImp0crC.js:579:8538 Fetching page 1 for “Taitranz” (pageSize: 10000)… index-BImp0crC.js:579:8633 Pro data for “Taitranz”: 2106 events fetched (new since last fetch) index-BImp0crC.js:579:10497 Incremental 24h fetch: processing 2106 events with 10000 existing events… index-BImp0crC.js:579:14471 Merged total: 10000 events (7894 kept + 2106 from fetch) index-BImp0crC.js:579:15205
✓ No changes since last fetch index-BImp0crC.js:579:15481 Total merged data: 10000 events from 1/1 accounts index-BImp0crC.js:579:15604
✓ Data looks complete: 10000 events spanning 112h (oldest: 15/10/2025, 5:10:26 pm) index-BImp0crC.js:579:16623 Cached to IndexedDB: 10000 events (4.47MB) index-BImp0crC.js:578:114252 This fetch was cancelled, skipping state update index-BImp0crC.js:579:17319 Pro data for “Taitranz”: 10000 events fetched (full history) index-BImp0crC.js:579:10497 Total merged data: 10000 events from 1/1 accounts index-BImp0crC.js:579:15604 Pro data for “Taitranz”: 10000 events fetched (full history) index-BImp0crC.js:579:10497 Total merged data: 10000 events from 1/1 accounts index-BImp0crC.js:579:15604 Cached to IndexedDB: 10000 events (4.47MB) index-BImp0crC.js:578:114252 Full refresh completed at 10:04:44 am index-BImp0crC.js:579:16998 Successfully fetched and merged API data: 10000 events index-BImp0crC.js:579:17593 Cached to IndexedDB: 10000 events (4.47MB) index-BImp0crC.js:578:114252 Full refresh completed at 10:04:44 am index-BImp0crC.js:579:16998 This fetch was cancelled, skipping state update index-BImp0crC.js:579:17319 Refreshing table row 0 index-BImp0crC.js:578:124759 Refreshing table row 1 index-BImp0crC.js:578:124759 Refreshing table row 2 index-BImp0crC.js:578:124759 Refreshing table row 3 index-BImp0crC.js:578:124759 Refreshing table row 4 index-BImp0crC.js:578:124759 Refreshing table row 5 index-BImp0crC.js:578:124759 Refreshing table row 6 index-BImp0crC.js:578:124759 Refreshing table row 7 index-BImp0crC.js:578:124759 Refreshing table row 8 index-BImp0crC.js:578:124759 Refreshing table row 9 index-BImp0crC.js:578:124759 Refreshing table row 10 index-BImp0crC.js:578:124759 Refreshing table row 11 index-BImp0crC.js:578:124759 Refreshing table row 12 index-BImp0crC.js:578:124759 Refreshing table row 13 index-BImp0crC.js:578:124759 Refreshing table row 14 index-BImp0crC.js:578:124759
First of all, this is an absolutely delightful tool for someone who refreshes the dashboard at least once every five requests (me). Second:
It needs a manual option to set the exchange rate.
It would be helpful to show the dollar amount in small type when a non-dollar currency is chosen as the primary currency.
How do you detect “unusually high usage”?
All my requests are marked as MAX, even though I hardly used MAX — is that intentional? (I have Pro+)
I get that it’s a different metric, but it’s still weird that Savings doesn’t include the value of things received for free beyond the purchased plan.
There should be a toggle to turn colors/columns on or off in the chart.
First screenshot:
“Excellent Cache Usage” should be green.
I used GPT-5 Pro only once — it’s strange that it’s listed in High Impact.
“3 High-Usage Models Detected Models with unusual usage: GPT-5 High, Grok Code Fast 1, GPT-5. Review these for optimization opportunities.” — that’s a weird message, because most likely those were requests that ran continuously on the models for 15–40 minutes and completed successfully or with some degree of success.
“You’re 73.0% over your monthly budget.” — official usage shows I’m over 100%.
Okay… so the difference was that the API for business accounts and pro/ultra accounts return the same data… there was no pagination and thought it was only 1 page (hence the logs)
All these issues are fixed now, including some fallbacks and more safety margins. I set it to 50k by default for now too. And lastly, you can set the page size yourself in the settings (inside accounts) if all else fails.
Thank you for the feedback! These are all helpful, just shows vibe coding and letting it be free won’t get it perfect
And as for your “MAX”, that’s because you have max calls MERGED, you can separate them at the top, select “Split by Mode” or “Fully Separate”.
The pricing you see in there when it’s merged should still account for max/non-max properly, but I can see there’s a big discrepancy. Does the $201.06 line up when you separate them?
The Three Modes:
1. Combined ('merged')
Merges everything together
Respects “Merge Checkpoints” setting
Doesn’t separate by maxMode
Example: claude-4-sonnet, claude-4-sonnet-1m, and claude-4-sonnet-2m all merge into one row
2. Split by Mode ('separate-max')
Does separate by maxMode (MAX vs non-MAX)
Does respect “Merge Checkpoints” setting
Example with “Merge Checkpoints” ON:
claude-4-sonnet + claude-4-sonnet-1m with maxMode: false → one row
claude-4-sonnet + claude-4-sonnet-1m with maxMode: true → separate row
In all modes all models in “Summary by Model” says, that they used in MAX.
This is probably the default label for all requests sent using pay-per-use mechanics (both included and not included in the plan), not the old requests mechanics.
99.9% of the code in my projects over the past six months has been written by Agent. I also heard a good phrase that a vibe coder becomes a software engineer when he begins to analyze what he has done.
You should be able to confirm this by going into either dashboard or cursor tokens → F12 → Network Tab → View the JSON of one of the filtered-events requests.

 View Your Dashboard → cursortokens.vercel.app