my macbook m1 14’’ was burning hot.
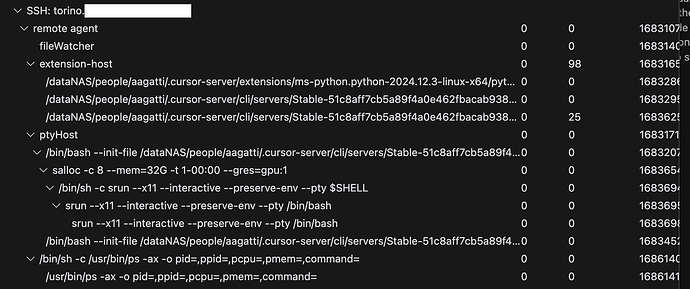
check the screenshot Cursor helper using 99% CPU.
program crashes, can’t save files, then found this.
pls check if there any sort of infinite loop running ![]()
@deanrie You commented to look here from my other post (Cursor-server using massive memory - #5 by darius).
Using htop on my server Im currently seeing dozens of processes from cursor (vscode) with 500mb each. One of those isnt huge… but that many is a lot and is using considerable ram. When I use the “Open Process Explorer” in vscode, it shows my server cursor as not having any meaningful RAM usage at all (not even a single instance of the 500mb seen using htop).
All of our users have dozens of these similar processes, is this normal? Sometimes these have negligible resident ram, but in this case its 0.5 gb and there are many of them. This is definitely affecting our servers performance.
That looks like normal htop behavior. It shows you all process threads by default, but threads share memory so you’re not using 500mb per thread.
Inside htop you can click H to hide threads.
Thanks @tmm1 thats helpful to know. Does the usage make sense? I don’t see any part of cursor using 500MB, but I do see that much from htop. This is less of an issue in this case with 500MB - but last weekend we were getting upto 40GB of memory usage from cursor.
Any idea how to locate this phantom process that is taking more ram?
Hey guys… my bad, it was caused by a plugin for VUE files conflicting with another one. thanks for the guidance.


