Since installing Cursor, I can only work in it for a limited amount of time. Either I notice the issue in time and restart my PC manually, or it freezes completely, forcing me to press the physical reset button. Closing and reopening Cursor doesn’t help, as it doesn’t release memory back to the system.
To cope, I’ve kept VS Code installed for my regular work. When I need advanced AI assistance, I open the project in Cursor, use the AI, then quickly close it.
This workflow feels inconvenient, especially since I’m paying for a premium subscription. I’ve been waiting for updates to fix the problem, but none have resolved it so far. Is this a known issue? Is anyone actively working on a fix?
My PC specs: Ryzen 7 3700X, 32GB RAM, Windows 10.
Ideally, either GitHub Copilot could match Cursor’s AI capabilities so I can stick to VS Code, or Cursor could fix its memory issues so I could use it exclusively. Right now, neither option is viable.
Does Cursor perform better on a Mac? Is this memory leak issue specific to Windows?
I’ve noticed something similar where it seems Cursor has some sort of memory leak which after a while starts to impact my entire computer, though usually I can just force close any Cursor processes and reopen it to fix the issue. Still annoying.
Running on an Intel Core i9-13900KS, 64GB DDR5 RAM, on only SSDs. Slowdown happens after multiple hours (basically, near the end of my work day) and seems like a slow memory leak.
Hey, while I’m not ruling out an issue on our end, usually crashes and high memory usage is due to extensions that are not very efficient!
I’d recommend launching Cursor with this command cursor --disable-extensions as that will turn off all the extensions, and show you the usage of Cursor itself!
I tried your suggestion, but working without extensions isn’t feasible. Without syntax highlighting, linting, or other essential tools, it’s like working in Notepad.
Considering that I imported the exact same extensions from VS Code when I first started Cursor, there must be a conflict between Cursor and one (or more) of these extensions. The key difference is that VS Code runs the same set of extensions and projects without hogging memory, whereas Cursor does.
It seems likely that something in Cursor itself is causing this issue.
I’m running VSCode on one screen and Cursor on another screen to compare.
Cursor stutters / freezes (and i’ve been pulling my hair out trying to figure out why) - tried upping CPU voltage to 1.4V to hold boost but that didnt work so bumped back down to save my CPU and ears from the fans.
There is definitely an issue (memtest showed no RAM issues, tested everything but the CPU on another PC) power delivery is fine, RAM, GPU etc.
Plus its JUST cursor that has this issue.
Thanks for the suggestion, but this hasnt resolved the issue.
I only have:
Azure Repos
C/C++
Github Actions
Github Repositories
Pylance
Python
Python Debugger
Remote Repositories
What do you see when you open the Process Explorer when Cursor starts to slow down?
If it’s a Cursor core process, and not an extension, finding out what shows there would be super helpful to track down any issues on our end!
This just happened again. Unfortunately, I couldn’t check the Process Explorer because everything freezes when the memory hits 99%. Up until that point, there’s no noticeable slowdown—it works fine until it doesn’t, and then I realize something is wrong when my mouse stops responding or the system locks up completely.
Is there a flag or setting that can log the Process Explorer details to a file so I can retrieve it after a forced reboot and share it here?
Not that I know off, your best bet would be to see how long it takes to crash on average, and checking Process Explorer routinely to see if anything is wrong.
It just happened again, this time with both the Process Explorer and Windows Task Manager open. Unfortunately, I couldn’t grab a screenshot because the system became unresponsive. However, I did notice that in Cursor’s Process Explorer, nothing stood out with significantly high numbers. In Task Manager, the top memory consumers were Firefox and Cursor, while Cursor was consistently at the top for CPU usage.
Here’s my typical setup:
Firefox for personal browsing
Chrome for testing the current project
One IDE instance for the API project (Node)
One IDE instance for the client app project (Vue)
When the IDE instances are Cursor, my OS crashes in 1-2 hours. When using VS Code, I can work indefinitely without any crashes.
I opened this thread to find out if others are experiencing the same issue.
There should be a simple way to log relevant data - a button or flag that saves logs into a file. I could then upload those logs here, allowing the Cursor team to identify the issue, release a patch, and make everyone happier.
Currently, I’m stuck paying for both GitHub Copilot and Cursor. I use Copilot as a surrogate for Cursor, even though it’s nowhere near as good. At the same time, I pay for Cursor, hoping it works long enough for the AI to help before it crashes.
The OS is unresponsive, can’t move the mouse, nothing. Only reset button on the PC case works.
That is how I notice, I try to move the mouse or to type something and nothing happens.
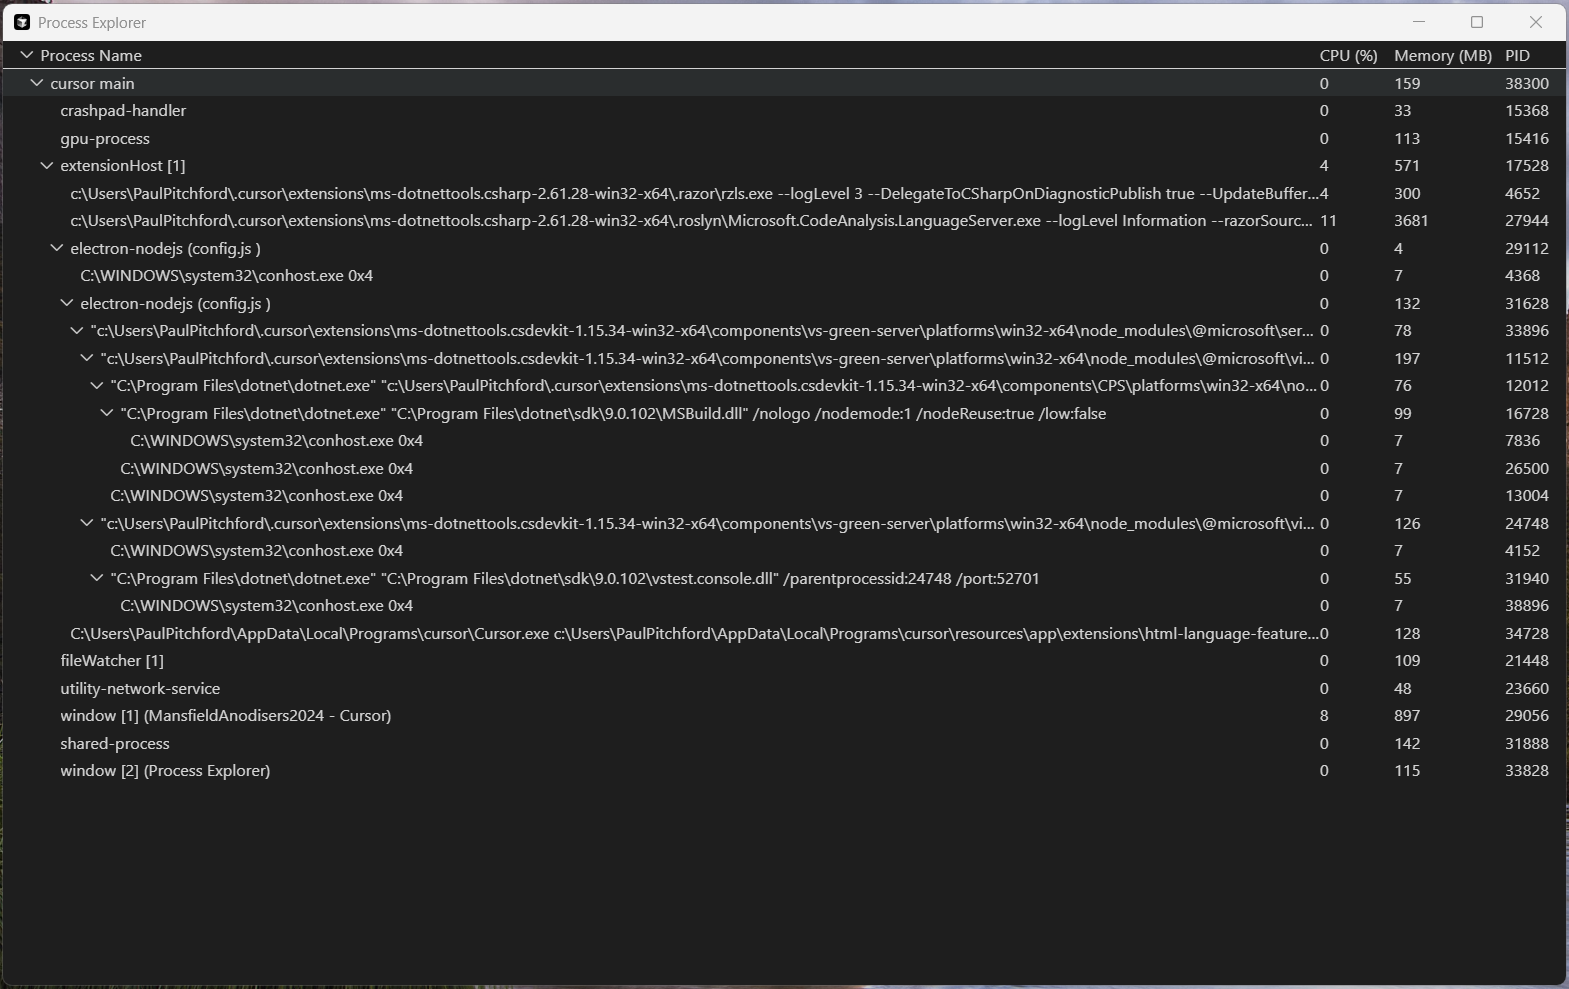
I’ve been getting the same today and came looking for cursor issues. Having followed this and looking at process monitor it looks like it’s something to do with the Language server?
As I sit here looking at the process monitor the usage is ticking up and up and up until it crashes. I’ve previously tried uninstalling cursor and reinstalling but guess I’ll have to go through my extensions. I don’t really have anything installed other than the Microsoft stuff for c#, github and 2 third party ones for material icons and blazor intellisense.
What language/framework are you working on when this happens?
The most likely culprit is a bad extension, so it may be worth trying to disable your extensions one by one to try and track down what is using up all your machine’s resources.
You can check if Cursor is doing this by running cursor --disable-extensions from Command Prompt, as this will disable all your extensions and show you the usage of just Cursor on it’s own.
Can you try uninstalling and reinstalling the Language Server extension that has the high RAM usage? It’s possible that if you imported your config from VSCode, that the version installed is not correctly compatible with Cursor.
There is nothing visible here that would suggest Cursor is eating too much memory, at least not in Process Explorer. In Task Manager it is on top, but only 1GB, which is not adding up to the percent used per system. There must be something we do not see. All I have is the observation that when using Cursor I have to restart PC every 1-2h and when using VS Code I don’t.
Also, when I use one VS Code and one Cursor I get more time, so when I need to focus on one project I run that in Cursor and the other just keep it open for testing in VS Code.
An option to collect anonymized logs would be useful.